Getting data from Intrinio
Another interesting source of financial data is Intrinio, which offers access to its free (with limits) database. The following list presents just a few of the interesting data points that we can download using Intrinio:
- Intraday historical data
- Real-time stock/option prices
- Financial statement data and fundamentals
- Company news
- Earnings-related information
- IPOs
- Economic data such as the Gross Domestic Product (GDP), unemployment rate, federal funds rate, etc.
- 30+ technical indicators
Most of the data is free of charge, with some limits on the frequency of calling the APIs. Only the real-time price data of US stocks and ETFs requires a different kind of subscription.
In this recipe, we follow the preceding example of downloading Apple’s stock prices for the years 2011 to 2021. That is because the data returned by the API is not simply a pandas DataFrame and requires some interesting preprocessing.
Getting ready
Before downloading the data, we need to register at https://intrinio.com to obtain the API key.
Please see the following link (https://docs.intrinio.com/developer-sandbox) to understand what information is included in the sandbox API key (the free one).
How to do it…
Execute the following steps to download data from Intrinio:
- Import the libraries:
import intrinio_sdk as intrinio import pandas as pd - Authenticate using your personal API key, and select the API:
intrinio.ApiClient().set_api_key("YOUR_KEY_HERE")
security_api = intrinio.SecurityApi()
You need to replace
YOUR_KEY_HEREwith your own API key.
- Request the data:
r = security_api.get_security_stock_prices( identifier="AAPL", start_date="2011-01-01", end_date="2021-12-31", frequency="daily", page_size=10000 ) - Convert the results into a DataFrame:
df = ( pd.DataFrame(r.stock_prices_dict) .sort_values("date") .set_index("date") ) - Inspect the data:
print(f"Downloaded {df.shape[0]} rows of data.")
df.head()
The output looks as follows:

Figure 1.5: Preview of the downloaded price information
The resulting DataFrame contains the OHLC prices and volume, as well as their adjusted counterparts. However, that is not all, and we had to cut out some additional columns to make the table fit the page. The DataFrame also contains information, such as split ratio, dividend, change in value, percentage change, and the 52-week rolling high and low values.
How it works…
The first step after importing the required libraries was to authenticate using the API key. Then, we selected the API we wanted to use for the recipe—in the case of stock prices, it was the SecurityApi.
To download the data, we used the get_security_stock_prices method of the SecurityApi class. The parameters we can specify are as follows:
identifier—stock ticker or another acceptable identifierstart_date/end_date—these are self-explanatoryfrequency—which data frequency is of interest to us (available choices: daily, weekly, monthly, quarterly, or yearly)page_size—defines the number of observations to return on one page; we set it to a high number to collect all the data we need in one request with no need for thenext_pagetoken
The API returns a JSON-like object. We accessed the dictionary form of the response, which we then transformed into a DataFrame. We also set the date as an index using the set_index method of a pandas DataFrame.
There’s more...
In this section, we show some more interesting features of Intrinio.
Not all information is included in the free tier. For a more thorough overview of what data we can download for free, please refer to the following documentation page: https://docs.intrinio.com/developer-sandbox.
Get Coca-Cola’s real-time stock price
You can use the previously defined security_api to get the real-time stock prices:
security_api.get_security_realtime_price("KO")
The output of the snippet is the following JSON:
{'ask_price': 57.57,
 'ask_size': 114.0,
 'bid_price': 57.0,
 'bid_size': 1.0,
 'close_price': None,
 'exchange_volume': 349353.0,
 'high_price': 57.55,
 'last_price': 57.09,
 'last_size': None,
 'last_time': datetime.datetime(2021, 7, 30, 21, 45, 38, tzinfo=tzutc()),
 'low_price': 48.13,
 'market_volume': None,
 'open_price': 56.91,
 'security': {'composite_figi': 'BBG000BMX289',
              'exchange_ticker': 'KO:UN',
              'figi': 'BBG000BMX4N8',
              'id': 'sec_X7m9Zy',
              'ticker': 'KO'},
 'source': 'bats_delayed',
 'updated_on': datetime.datetime(2021, 7, 30, 22, 0, 40, 758000, tzinfo=tzutc())}
Download news articles related to Coca-Cola
One of the potential ways to generate trading signals is to aggregate the market’s sentiment on the given company. We could do it, for example, by analyzing news articles or tweets. If the sentiment is positive, we can go long, and vice versa. Below, we show how to download news articles about Coca-Cola:
r = intrinio.CompanyApi().get_company_news(
    identifier="KO",
    page_size=100
)

df = pd.DataFrame(r.news_dict)
df.head()
This code returns the following DataFrame:

Figure 1.6: Preview of the news about the Coca-Cola company
Search for companies connected to the search phrase
Running the following snippet returns a list of companies that Intrinio’s Thea AI recognized based on the provided query string:
r = intrinio.CompanyApi().recognize_company("Intel")
df = pd.DataFrame(r.companies_dict)
df
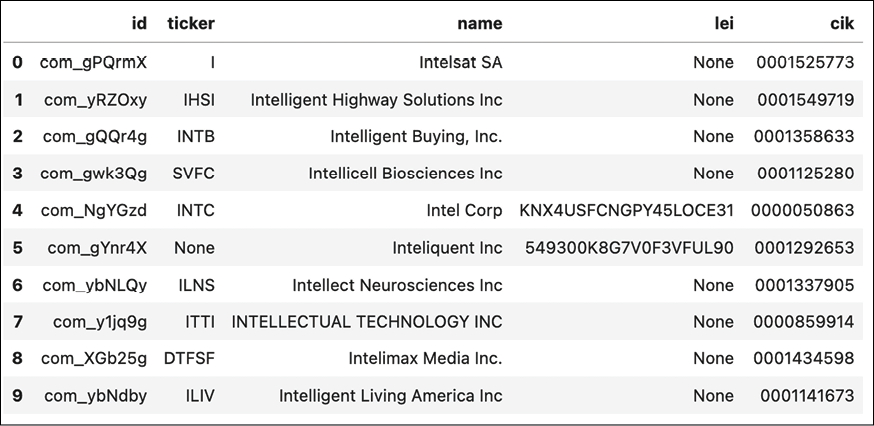
As we can see, there are quite a few companies that also contain the phrase “intel” in their names, other than the obvious search result.

Figure 1.7: Preview of the companies connected to the phrase “intel”
Get Coca-Cola’s intraday stock prices
We can also retrieve intraday prices using the following snippet:
response = (
    security_api.get_security_intraday_prices(identifier="KO",
                                              start_date="2021-01-02",
                                              end_date="2021-01-05",
                                              page_size=1000)
)
df = pd.DataFrame(response.intraday_prices_dict)
df
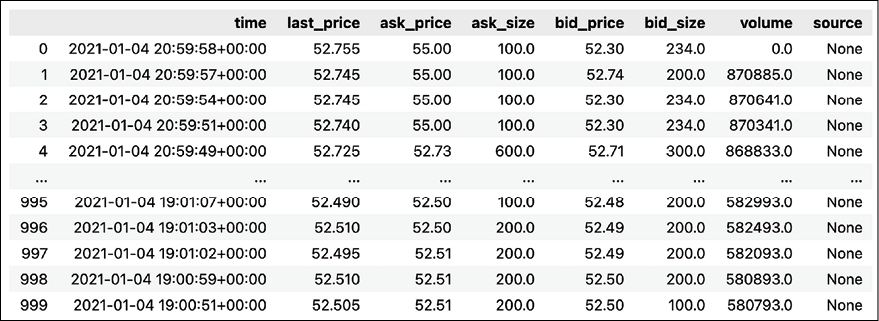
Which returns the following DataFrame containing intraday price data.

Figure 1.8: Preview of the downloaded intraday prices
Get Coca-Cola’s latest earnings record
Another interesting usage of the security_api is to recover the latest earnings records. We can do this using the following snippet:
r = security_api.get_security_latest_earnings_record(identifier="KO")
print(r)
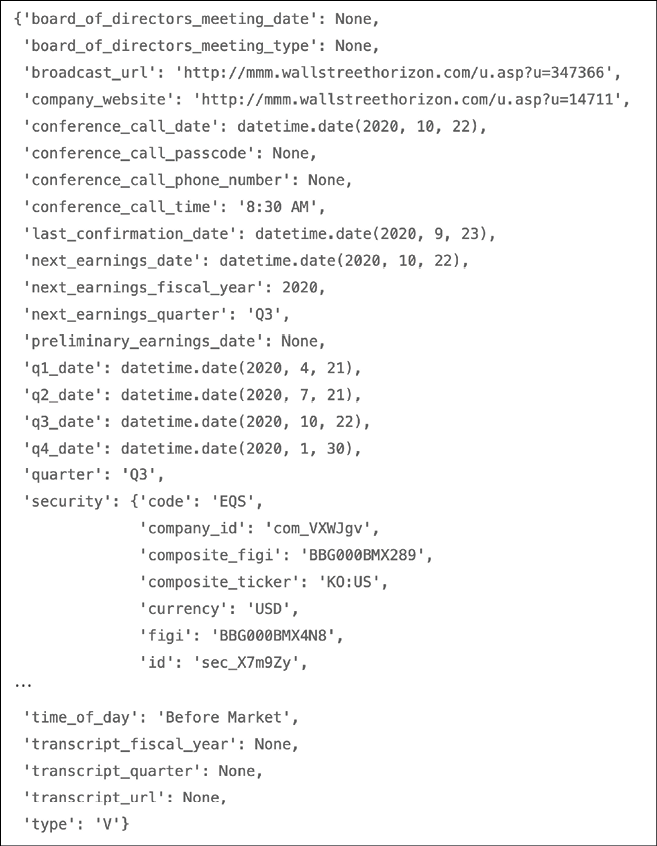
The output of the API call contains quite a lot of useful information. For example, we can see what time of day the earnings call happened. This information could potentially be used for implementing trading strategies that act when the market opens.

Figure 1.9: Coca-Cola’s latest earnings record
See also
- https://docs.intrinio.com/documentation/api_v2/getting_started—the starting point for exploring the API
- https://docs.intrinio.com/documentation/api_v2/limits—an overview of the querying limits
- https://docs.intrinio.com/developer-sandbox—an overview of what is included in the free sandbox environment
- https://docs.intrinio.com/documentation/python—thorough documentation of the Python SDK


