Search icon CANCEL
Subscription
0
Cart icon
Your Cart (0 item)
Close icon
You have no products in your basket yet
Save more on your purchases! discount-offer-chevron-icon
Savings automatically calculated. No voucher code required.
Arrow left icon
Explore Products
Best Sellers
New Releases
Books
Videos
Audiobooks
Learning Hub
Free Learning
Arrow right icon
Arrow up icon
GO TO TOP
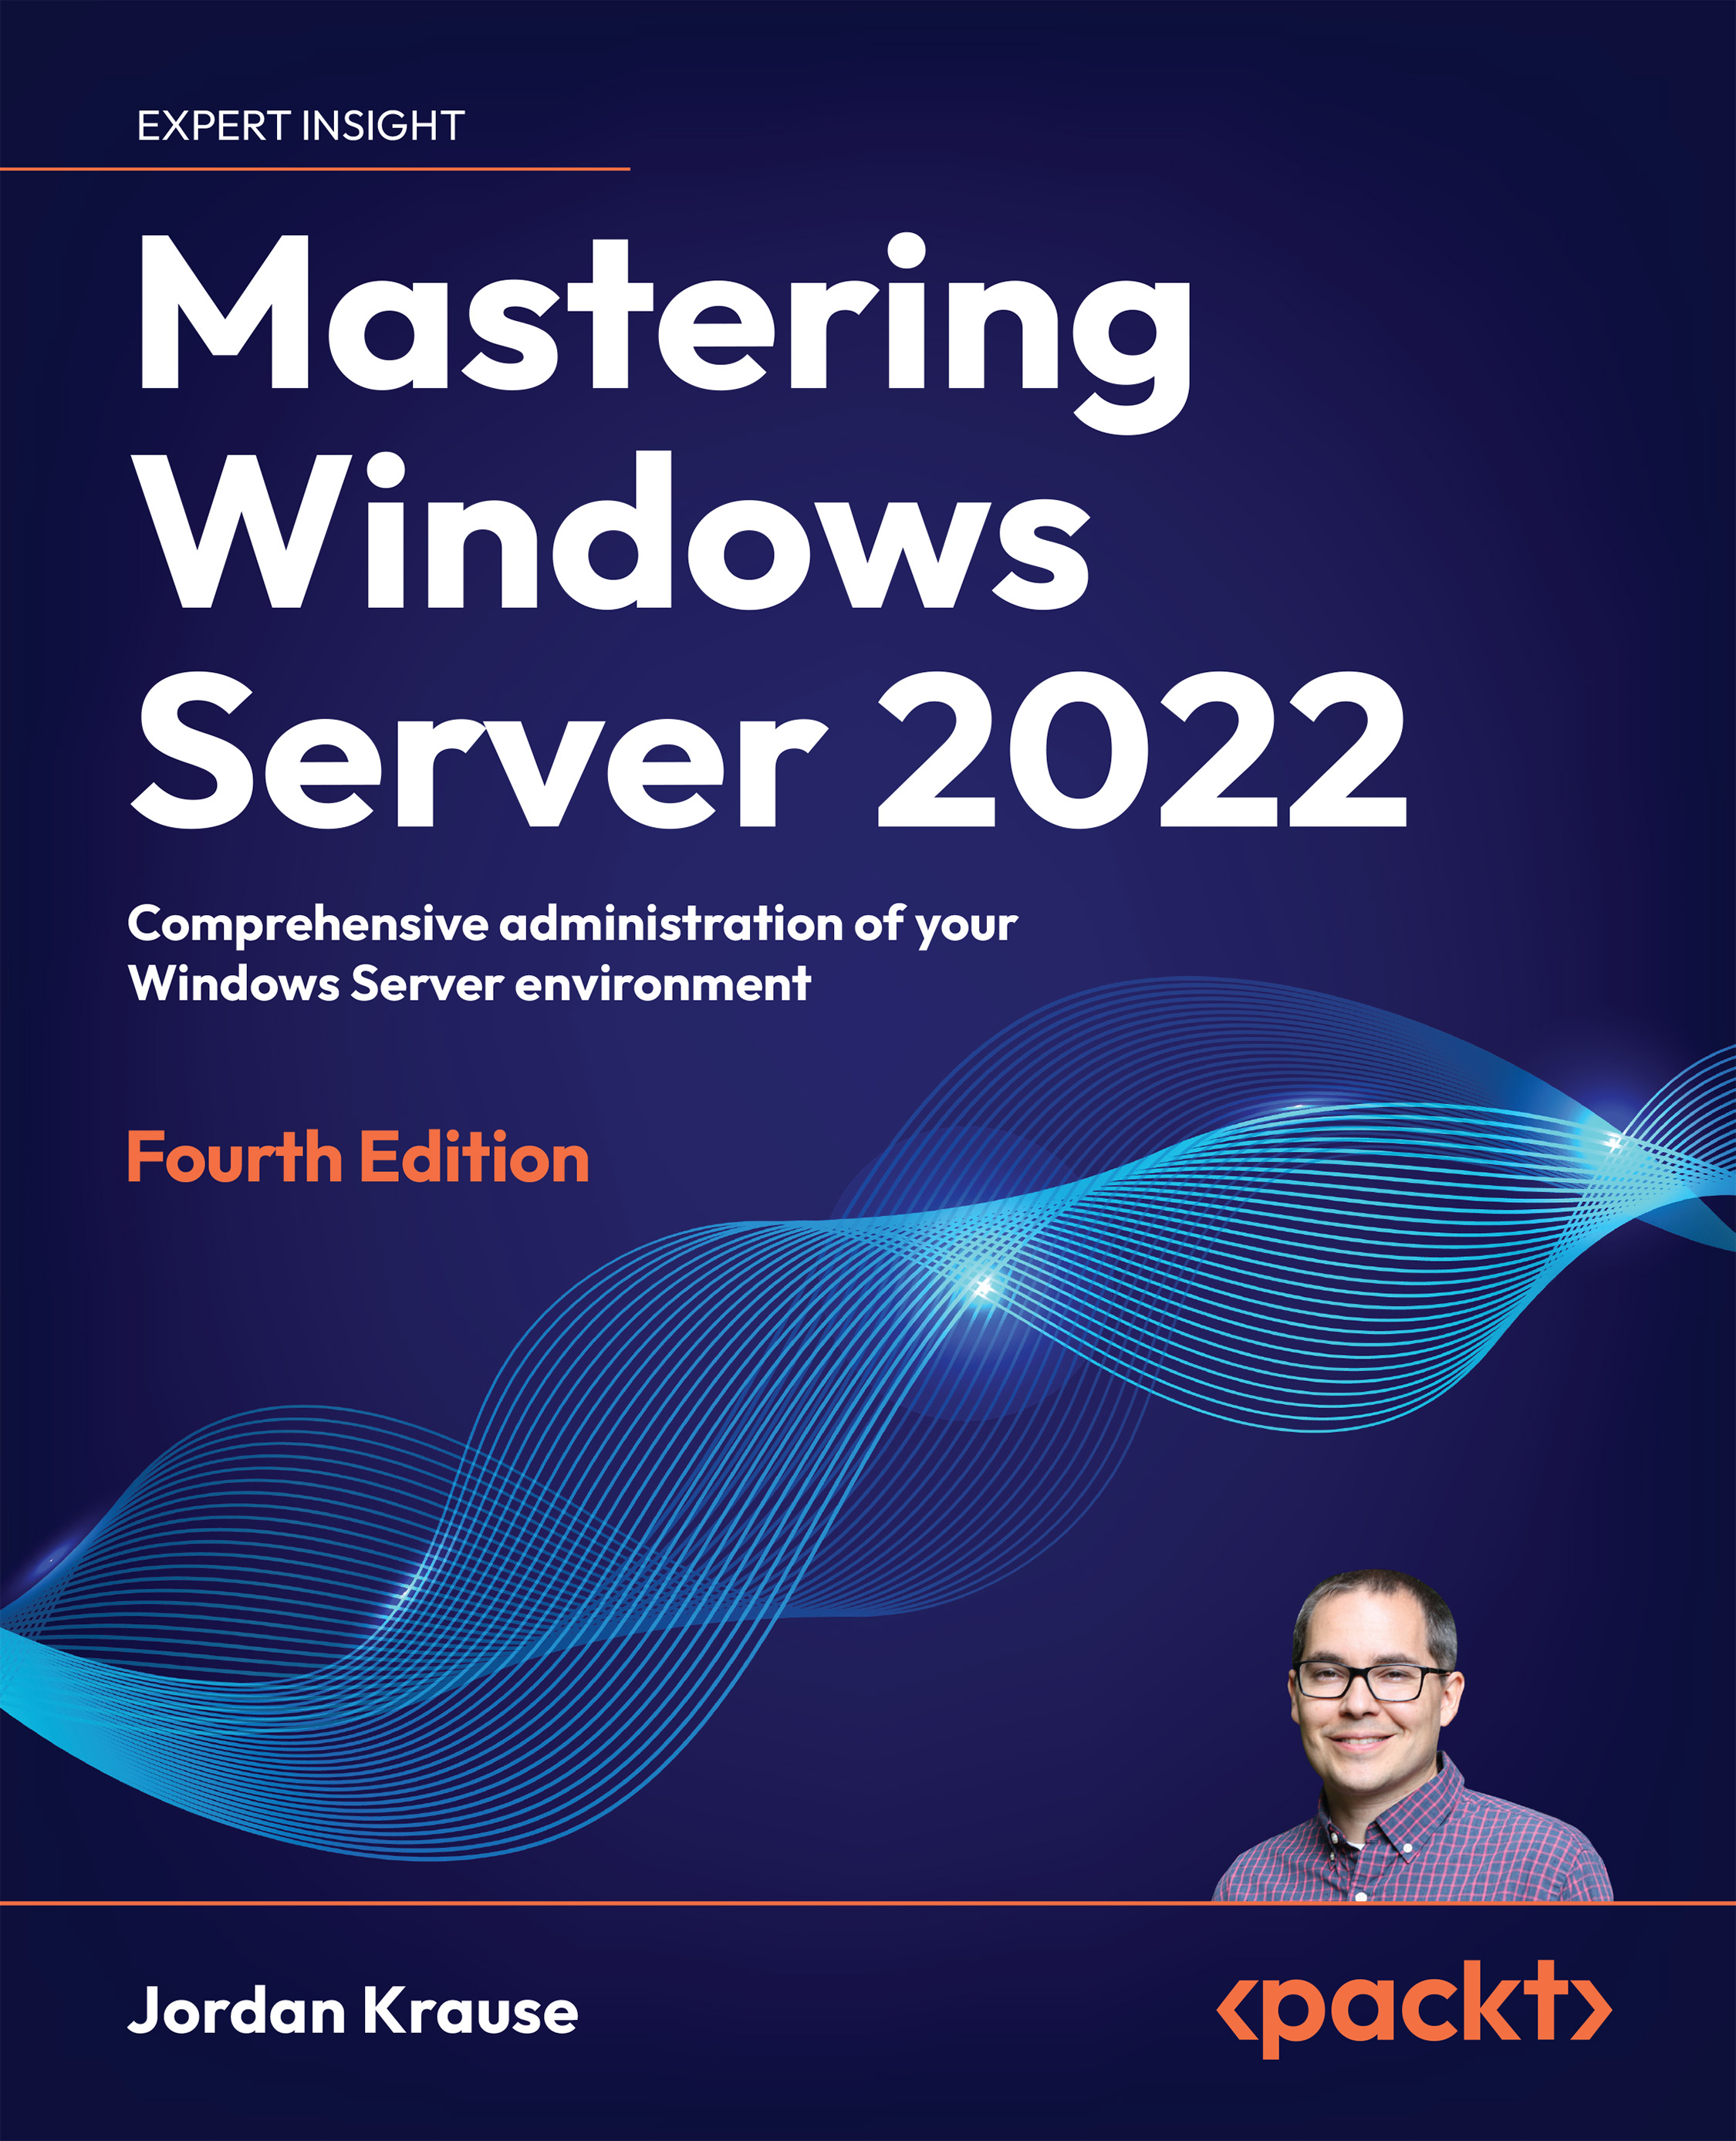
Mastering Windows Server 2022

You're reading from   Mastering Windows Server 2022 Comprehensive administration of your Windows Server environment

Arrow left icon
Product type Paperback
Published in May 2023
Publisher Packt
ISBN-13 9781837634507
Length 720 pages
Edition 4th Edition
Languages
Arrow right icon
Author (1):
Arrow left icon
Jordan Krause Jordan Krause
Author Profile Icon Jordan Krause
Jordan Krause
Arrow right icon
View More author details
Toc

Table of Contents (20) Chapters Close

Preface 1. Getting Started with Windows Server 2022 2. Installing and Managing Windows Server 2022 FREE CHAPTER 3. Active Directory 4. DNS and DHCP 5. Group Policy 6. Certificates 7. Networking with Windows Server 2022 8. Remote Access 9. Hardening and Security 10. Server Core 11. PowerShell 12. Redundancy in Windows Server 2022 13. Containers 14. Hyper-V 15. Remote Desktop Services 16. Troubleshooting 17. Other Books You May Enjoy
18. Index
Appendix: Answers to the End-of-Chapter Questions

Performance Monitor

Another built-in monitoring tool is called Performance Monitor, commonly referred to as Perfmon. Almost every component inside Windows Server has predefined performance monitor counters, and Perfmon taps into those counters to display extremely in-depth information about what is happening with those components, but only when you specifically set up reporting to see it. Perfmon does not log anything by default, because to do so would consume plenty of server resources, so this tool is generally only to be used temporarily during troubleshooting or for a specific reason, and then disabled again when you are finished.

The easiest way to launch Perfmon is to Start | Run or open a Command Prompt or PowerShell, simply type Perfmon, and then press Enter. This launches the interface, and by default, you can see that it has plugged in a counter for % Processor Time. You can obviously find CPU percentage information in much easier and better-looking places than Perfmon...

lock icon The rest of the chapter is locked
Register for a free Packt account to unlock a world of extra content!
A free Packt account unlocks extra newsletters, articles, discounted offers, and much more. Start advancing your knowledge today.
Unlock this book and the full library FREE for 7 days
Get unlimited access to 7000+ expert-authored eBooks and videos courses covering every tech area you can think of
Renews at $19.99/month. Cancel anytime
Banner background image