Frontend installation and configuration
In this recipe, we will finalize our setup with the installation and configuration of the Zabbix web interface. Our Zabbix configuration is different from other monitoring tools such as Nagios in the way that the complete configuration is stored in a database. This means, that we need a web interface to be able to configure and work with the Zabbix server. It is not possible to work without the web interface and just make use of some text files to do the configuration. It is however possible to work with the API, but that is something we will see later in Chapter 10.
Getting ready
To be successful with this installation, you need to have installed the Zabbix server, as explained previously. It's not necessary to have the Zabbix client installed but it is recommended. This way, we can monitor our Zabbix server because we have a Zabbix agent running on our Zabbix server. This can be useful in monitoring your own Zabbix servers health status, as we will see later.
How to do it...
- The first thing we need to do is go back to our prompt and install the Zabbix web frontend packages.
# yum install zabbix-web zabbix-web-mysql - With the installation of our Zabbix-web package, Apache was installed too, so we need to start Apache first and make sure it will come online after a reboot:
# chkconfig httpd on; service start httpd
# systemctl start httpd; systemctl enable httpd (for RHEL 7)
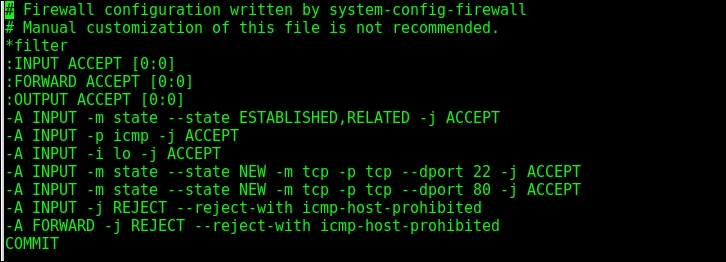
- Remember we have a firewall, so the same rule applies here. We need to open the port for the web server to be able to see our Zabbix frontend. Edit the
/etc/sysconfig/iptablesfirewall file and add after the line withdport 22in the next line:# -A INPUT -m state –state NEW -m tcp -p tcp –dport 80 -j ACCEPTTip
If iptables is too intimidating for you, then an alternative could to make use of Shorewall. http://www.cyberciti.biz/faq/centos-rhel-shorewall-firewall-configuration-setup-howto-tutorial/.
Users of RHEL 7 can run the following lines:
# firewall-cmd --permanent --add-service=httpThe following screenshot shows the firewall configuration:
- Now that the firewall is adjusted, you can save and restart the firewall:
# iptables-save
# service iptables restart
# firewall-cmd --reload (If you run RHEL 7)
- Now edit the Zabbix configuration file with the PHP setting. Uncomment the option for the
timezoneand fill in the correct timezone:# vi /etc/httpd/conf.d/zabbix.conf php_value date.timezone Europe/Brussels
- It is now time to reboot our server and see if everything comes back online with our Zabbix server configured like we intended it to. The reboot here is not necessary but it's a good test to see if we did a correct configuration of our server:
# reboot - Now let's see if we get to see our Zabbix server. Go to the URL of our Zabbix server that we just have installed:
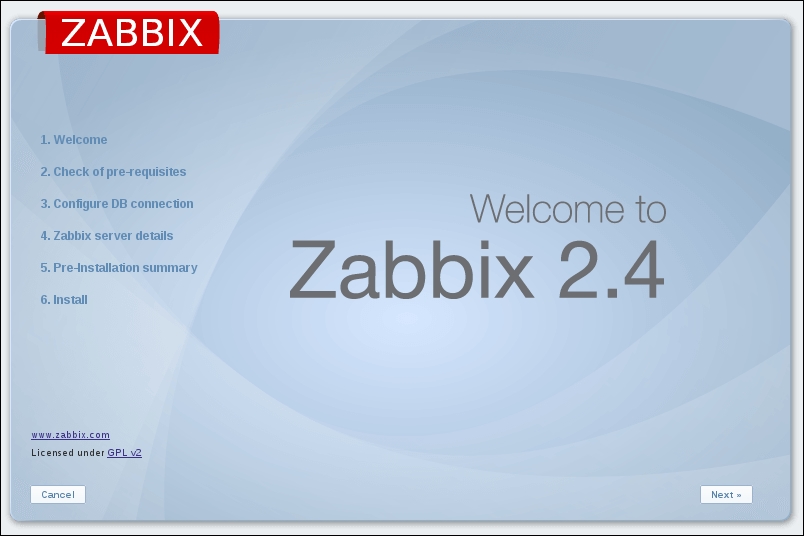
# http://<ip of the Zabbix server>/zabbix - On the first page, we see our welcome screen. Here, we can just click Next:
Tip
The standard Zabbix installation will run on port 80, although It isn't really a safe solution. It would be better to make use of HTTPS. However, this is a bit out of the scope of this book but could be done with not too much extra work and would make Zabbix more safe. http://wiki.centos.org/HowTos/Https.
- Next screen, Zabbix will do a check of the PHP settings. Normally they should be fine as Zabbix provides a file with all correct settings. We only had to change the
timezoneparameter, remember? In case something goes wrong, go back to thezabbix.conffile and check the parameters: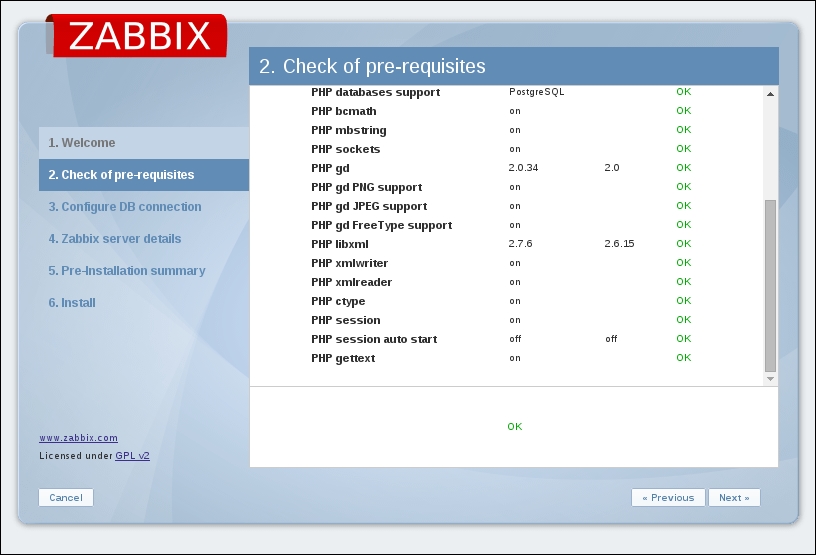
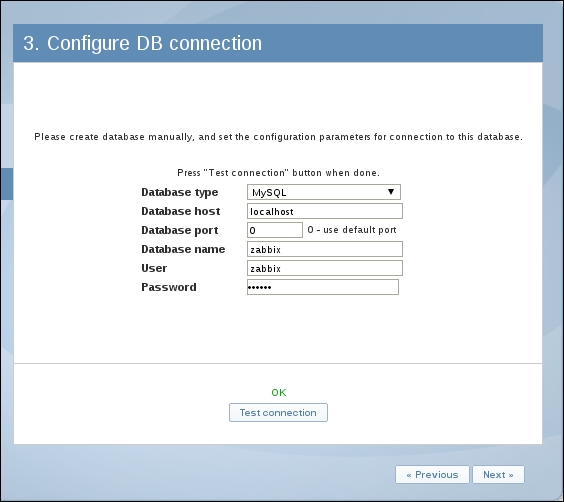
- Next, we can fill in our connection details to connect to the database. If you remember, we did this already when we installed the server. Don't panic, it's completely normal. Zabbix, as we will see later, can be setup in a modular way so the frontend and the server both need to know where the database is and what the login credentials are. Press Test connection and when you get an OK just press Next again:
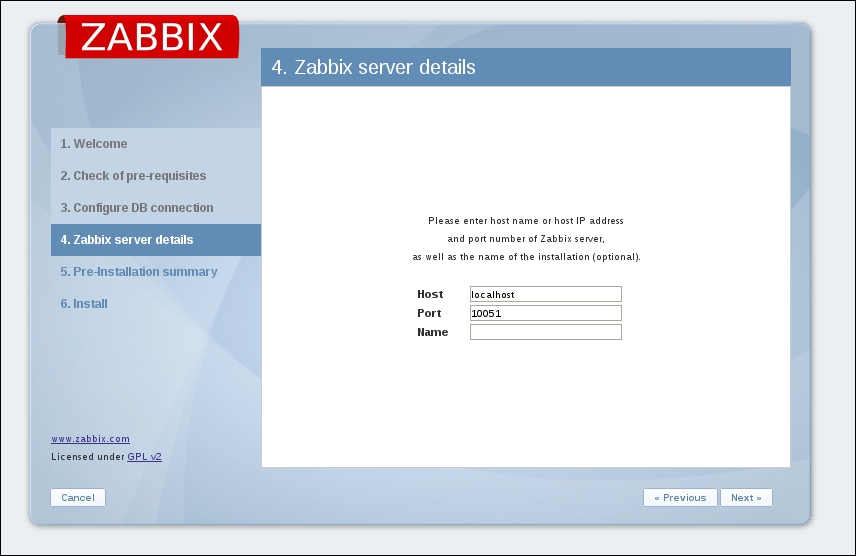
- Next screen, we have to fill in some Zabbix server details. Host and port should already be filled in; if not, put the correct IP and port in the fields. The field Name is not really important for the working of our Zabbix server but it's probably better to fill in a meaningful name here for your Zabbix installation:
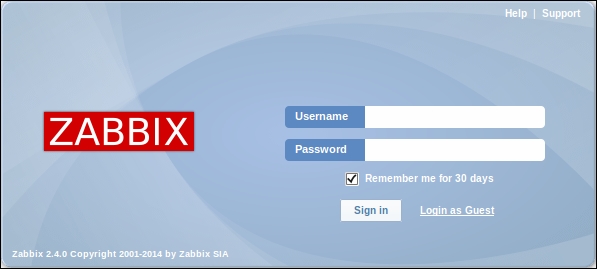
- Now our setup is finished, and we can just click Next till we get our login screen. The Username and Password are standard the first time we set up the Zabbix server and are Admin for Username and zabbix for the Password:
How it works...
For the frontend, we had to install the web interface package from our Zabbix repository. For the web interface to work, we had to install a web server; one of the dependencies of Zabbix is the Apache web server. It is possible that in other repositories, this is not the case, so always make sure that Apache or some other web server is installed. The installed frontend is written in PHP.
To be able to connect to the web interface from another system, we had to open the firewall port on our Zabbix server, this was port 80.
Because the Zabbix setup can be modular, the frontend needs to know the location, the username and password of the database, and also the location of the Zabbix server and the correct port the Zabbix server communicates through. Normally, the standard port of the Zabbix server is 10051 and in our case everything is installed locally so localhost can be used.
If you make use of SELinux, you need to alter some of its settings or else, Zabbix will not work. Either you disable SELinux completely in the /etc/selinux/config file by replacing the SELINUX=enforcing parameter to SELINUX=permissive parameter. Once this is done, you run from the command line setenforce 0. Another option is to configure SELinux and this is the safest way. This can be done by running the following commands from the prompt:
setsebool -P zabbix_can_network on   (for the agent)
setsebool -P httpd_can_network_connect  on  (for the server)
setsebool -P httpd_can_network_connect_db  on (for the server)
There's more...
Of course there is more to the frontend that can be tweaked. In case we want to edit the frontend configuration, it can be done under the /usr/share/zabbix/include/defines.inc.php file.
Here is a list of the most important things that can be altered. A complete list can be found in the Zabbix online documentation.
https://www.zabbix.com/documentation/2.4/manual/web_interface/definitions.
|
Parameter |
Option |
|---|---|
|
ZBX_LOGIN_ATTEMPTS |
Number of login attempts before ZBX_LOGIN_BLOCK is activated |
|
ZBX_LOGIN_BLOCK |
Number of seconds to wait after too many login attempts |
|
ZBX_MIN_PERIOD |
Min zoom period for graphs |
|
ZBX_MAX_PERIOD |
Max zoom period for graphs |
|
ZBX_PERIOD_DEFAULT |
Default graph period in seconds |
|
GRAPH_YAXIS_SIDE_DEFAULT |
Default side for the Y axis; can be changed from left to right |
|
ZBX_WIDGET_ROWS |
Popup row limit |
|
ZBX_UNITS_ROUNDOFF_THRESHOLD |
Threshold value for roundoff constants |
|
ZBX_UNITS_ROUNDOFF_UPPER_LIMIT |
Number of digits after comma, when value is greater than roundoff threshold |
|
ZBX_UNITS_ROUNDOFF_LOWER_LIMIT |
Number of digits after comma, when value is less than roundoff threshold |
|
ZBX_HISTORY_DATA_UPKEEP |
Number of days, which will reflect on frontend choice when deciding which history or trends table to process |


