Search icon CANCEL
Subscription
0
Cart icon
Your Cart (0 item)
Close icon
You have no products in your basket yet
Arrow left icon
Explore Products
Best Sellers
New Releases
Books
Videos
Audiobooks
Learning Hub
Free Learning
Arrow right icon
Arrow up icon
GO TO TOP
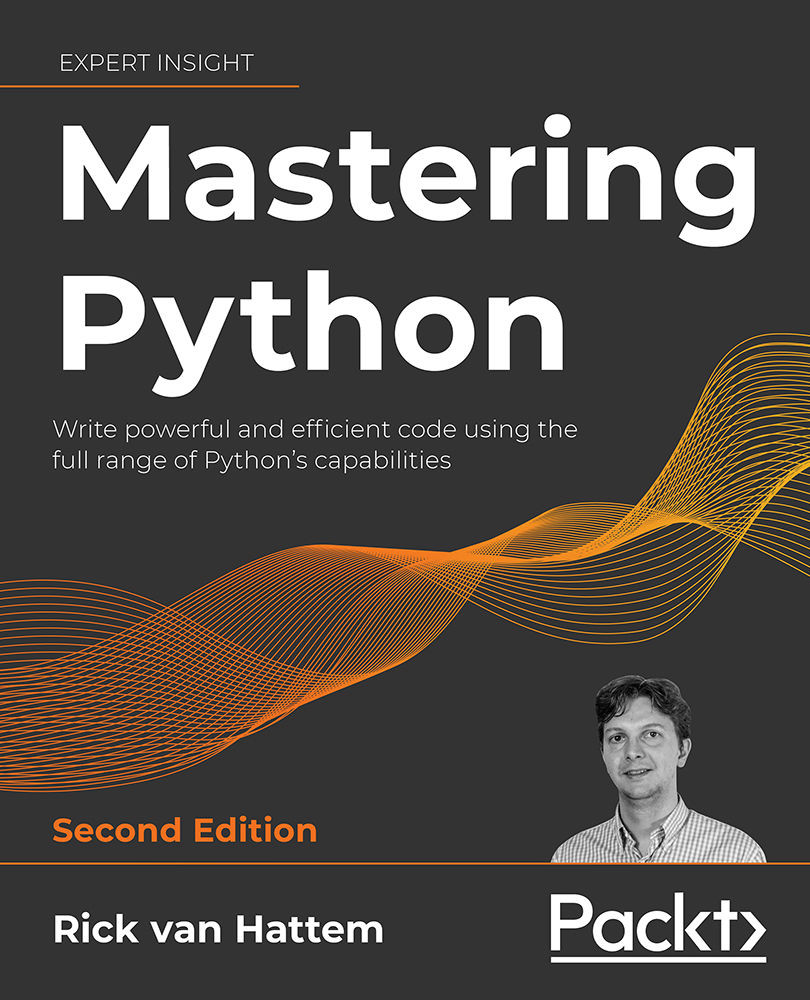
Mastering Python 2E

You're reading from   Mastering Python 2E Write powerful and efficient code using the full range of Python's capabilities

Arrow left icon
Product type Paperback
Published in May 2022
Last Updated in May 2022
Publisher Packt
ISBN-13 9781800207721
Length 710 pages
Edition 2nd Edition
Languages
Tools
Arrow right icon
Author (1):
Arrow left icon
Rick Hattem Rick Hattem
Author Profile Icon Rick Hattem
Rick Hattem
Arrow right icon
View More author details
Toc

Table of Contents (21) Chapters Close

Preface 1. Getting Started – One Environment per Project 2. Interactive Python Interpreters FREE CHAPTER 3. Pythonic Syntax and Common Pitfalls 4. Pythonic Design Patterns 5. Functional Programming – Readability Versus Brevity 6. Decorators – Enabling Code Reuse by Decorating 7. Generators and Coroutines – Infinity, One Step at a Time 8. Metaclasses – Making Classes (Not Instances) Smarter 9. Documentation – How to Use Sphinx and reStructuredText 10. Testing and Logging – Preparing for Bugs 11. Debugging – Solving the Bugs 12. Performance – Tracking and Reducing Your Memory and CPU Usage 13. asyncio – Multithreading without Threads 14. Multiprocessing – When a Single CPU Core Is Not Enough 15. Scientific Python and Plotting 16. Artificial Intelligence 17. Extensions in C/C++, System Calls, and C/C++ Libraries 18. Packaging – Creating Your Own Libraries or Applications 19. Other Books You May Enjoy
20. Index

Summary

When it comes to performance, there is no holy grail, no single thing you can do to ensure peak performance in all cases. This shouldn’t worry you, however, as in most cases, you will never need to tune the performance and, if you do, a single tweak could probably fix your problem. You should be able to find performance problems and memory leaks in your code now, which is what matters most, so just try to contain yourself and only tweak when it’s actually needed.

Here is a quick recap of the tools in this chapter:

  • Measuring CPU performance: timeit, profile/cProfile, and line_profiler
  • Analyzing profiling results: SnakeViz, pyprof2calltree, and QCacheGrind
  • Measuring memory usage: tracemalloc, memory_profiler
  • Reducing memory usage and leaks: weakref and gc (garbage collector)

If you know how to use these tools, you should be able to track down and fix most performance issues in your code.

The most important takeaways...

lock icon The rest of the chapter is locked
Register for a free Packt account to unlock a world of extra content!
A free Packt account unlocks extra newsletters, articles, discounted offers, and much more. Start advancing your knowledge today.
Unlock this book and the full library FREE for 7 days
Get unlimited access to 7000+ expert-authored eBooks and videos courses covering every tech area you can think of
Renews at $19.99/month. Cancel anytime
Banner background image