The Visual Studio Code user interface
Visual Studio Code is one of the most widely used development environments worldwide. It is engineered to make it easy and quick to design cloud- and web-based applications, using a vast plethora of extensible languages. The application is focused on maximizing code editing and unleashing the developer’s potential by providing useful shortcuts to provide quick access to all that is needed in a specific development context.
Visual Studio Code can be downloaded officially at https://code.visualstudio.com/ and, like most Integrated Development Environments (IDEs) nowadays, it has two different branches or deployment channels for its build: stable and insider. Together with these, it could also be used as a web application (https://vscode.dev/) or deployed on different platforms than Microsoft Windows, like iOS or Linux.
When you start Visual Studio Code, freshly installed locally, it will show you the typical Welcome page:
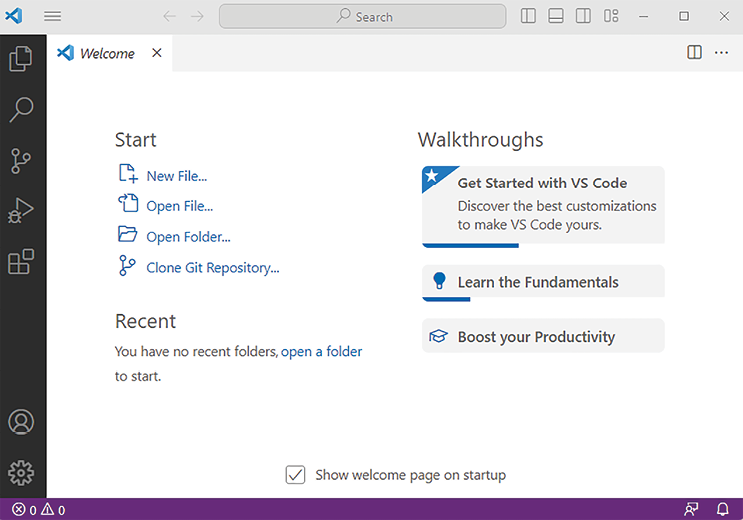
Figure 2.1: Visual Studio Code Welcome page
The Welcome page contains the following:
- Start: Shortcuts for creating and opening files and folders
- Recent: A list of recently opened files and folders
- Walkthroughs: A series of sliders that would help you tailor Visual Studio Code through your favorite settings such as background color themes, useful features enablement, and so on
The Welcome page is loaded whenever you run Visual Studio Code as a new window (Ctrl + Shift + N). It is possible to change this behavior by unchecking Show welcome page on startup or clicking File | Preferences | Settings and searching for Welcome page.
The Visual Studio Code environment is divided into five main areas:
- Code editor
- Status bar
- Activity bar
- Sidebar
- Panels area
Let’s look at each of them in the following sections, but if you want to check the documentation reference first, please visit https://code.visualstudio.com/docs/getstarted/userinterface.
Code editor
The code editor is where you write your code and where you spend most of your time. It is activated when creating a new file, or when opening an existing file or folder.
You can edit just one single file, or you can even load and work with multiple files at the same time, side by side, in editor groups:
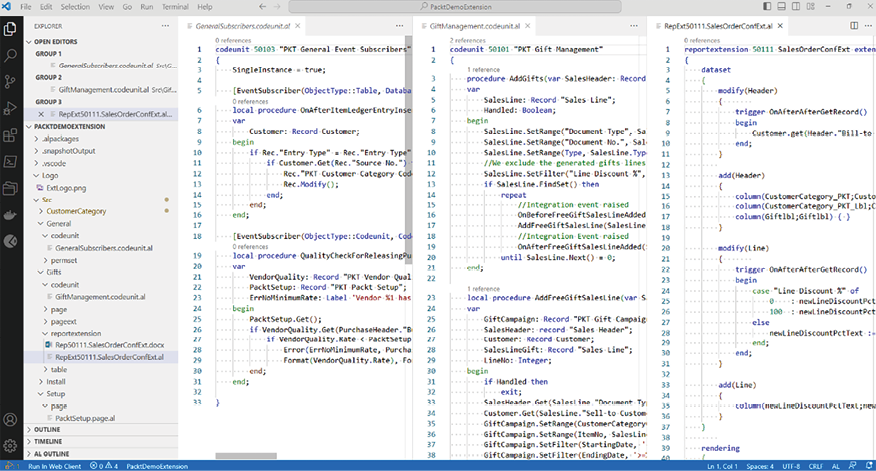
Figure 2.2: Working on multiple files with editor groups
There are different ways to have multiple file views; three are mentioned here:
- Select a filename in the EXPLORER bar, then right-click and select Open to the Side (Ctrl + Enter).
- Press Ctrl + click on a filename in the EXPLORER bar.
- Press Ctrl +
\to split the editor into two parts.
Editor groups will accommodate several files, dividing the space equally between them. You can move through the different file editors by simply pressing Ctrl + 1, Ctrl + 2, Ctrl + 3, …, Ctrl + N.
Editor windows can be resized, reordered, and zoomed in/out according to your needs. To zoom in/out, press Ctrl + +/Ctrl + -, or View | Zoom in/Zoom out.
Zooming applies to all Visual Studio Code areas, not only to the code editor.
Visual Studio Code also provides an easy way of navigating between files with shortcuts. The quickest way is to press Ctrl + Tab. This will open the list of files that have been opened since Visual Studio Code started.
Last but not least, Ctrl + R could be considered the most used one. This will open a list of the recent files opened in the Command Palette.
Status bar
The status bar typically contains information about the currently selected file or folder. It also provides some actionable shortcuts:

Figure 2.3: Status bar shortcuts
From left to right, the status bar contains the following information:
- If Git is enabled, it will report version control information, such as, for example, the current branch.
- Number of errors and/or warnings detected in the current code.
- Cursor position (line position and column position).
- Indentation size and type (spaces or tabs).
- Encoding of the currently selected file.
- Line terminator: Carriage return (CR) and/or line feed (LF).
- Language used to process the code in the selected file. If you click on the language, a menu list will appear, and you should be able to change the processing programming language.
- Feedback button, which you can use to share your feedback about Visual Studio Code on Twitter/X or open a bug or feature implementation request.
- Notification icon: This shows the number of new notifications, which are typically related to product updates.
The status bar has a conventional colorization, and it changes depending on what’s processing. For example, it is purple when opening a new window or a new file, blue when opening a folder, orange when debugging, and so on.
Activity bar
This is on the left side of the workspace and contains shortcuts to the sidebar. If a shortcut is clicked, the sidebar that belongs to the tool that has been chosen becomes visible. Clicking again, or – for the shortcut lovers – pressing Ctrl + B, makes it disappear.
Manage
The Manage button is shown with a gear icon at the very bottom of the activity bar. If you click on it, a pop-up menu with a list of commands appears. These commands are used to tailor and customize Visual Studio Code at will, or to search for updates.
Command Palette
The Command Palette is one of the most important tools in Visual Studio Code. Its purpose is to give quick access to standard and extended commands. There are different ways to run the Command Palette:
- F1 (most used by all developers)
- Keyboard shortcut: Ctrl + Shift + P
- View | Command Palette
- The Manage button (the gear icon) | Command Palette
The Command Palette is not only good for showing menu commands but it can also perform other actions, such as installing extensions. You can browse through it to review the huge list of available commands. Commands are indexed and searchable. Just type a few letters to get a filtered list. It’s worth mentioning the long list of keyboard shortcuts that are available for most of these commands.
One very important thing to know about the Command Palette is the use of the > sign. When you press Ctrl + Shift + P, the Command Palette pops up with the > sign and shows the list of commands available. Take a look at the following screenshot:

Figure 2.4: Commands suggested by the Command Palette
If you remove the > symbol, Visual Studio Code uses the Command Palette to show a list of the recently opened files. The following screenshot shows this:

Figure 2.5: Recent files in the Command Palette
The power of this feature is that, without using the mouse, you can open the Command Palette, run a command, remove the > character, and select a file to edit (which is equivalent to using the shortcut Ctrl + P). That’s fantastic for development productivity.
Sidebar
The sidebar is the place where you will interact the most with the code editor. It is context-sensitive, and you will find five standard activities, each enabled by the corresponding icon in the view bar.
EXPLORER (Ctrl + Shift + E)
EXPLORER provides a structured and organized view of the folder and files that you are currently working with. The OPEN EDITORS sub-view contains the list of active files in the code editor. Below this section, there is another sub-view with the name of the folder that is open:
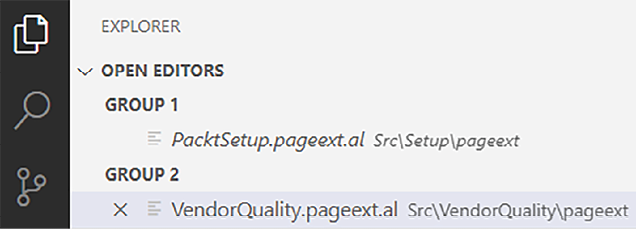
Figure 2.6: OPEN EDITORS sub-view
If you hover over the OPEN EDITORS sub-view, four action buttons will be shown: New (Ctrl + N), Toggle Vertical/Horizontal Editor Layout (Shift + Alt + O), Save All (Ctrl + K + S), and Close All Files (Ctrl + K or Ctrl + W):

Figure 2.7: OPEN EDITORS actions
Hovering over the folder name or any part of the sidebar (in this example, PACKTDEMOEXTENSION) will make four action buttons visible:

Figure 2.8: Example folder action buttons
From left to right, these are New File, New Folder, Refresh, and Collapse All.
Right-clicking on a folder or filename will open a context menu that shows common commands such as Reveal in Explorer (Shift + Alt + R), which opens the folder that contains the selected file. You can also copy the file path via Copy Path (Shift + Alt + C).
When you start working with it, you might not like the OPEN EDITORS area, especially when you are in the middle of heavy development, since this takes up quite a lot of your screen when you have lots of files open at the same time. You can easily disable Open Editors to get that space back by clicking on the EXPLORER bar ellipsis and unchecking Open Editors.
Further down in the EXPLORER bar, there is another section called OUTLINE. It gives a very useful tree view of members and types for a specific file, based on its language extension. If you have AL Language already installed, you might have this enabled. Take a look at the following screenshot:
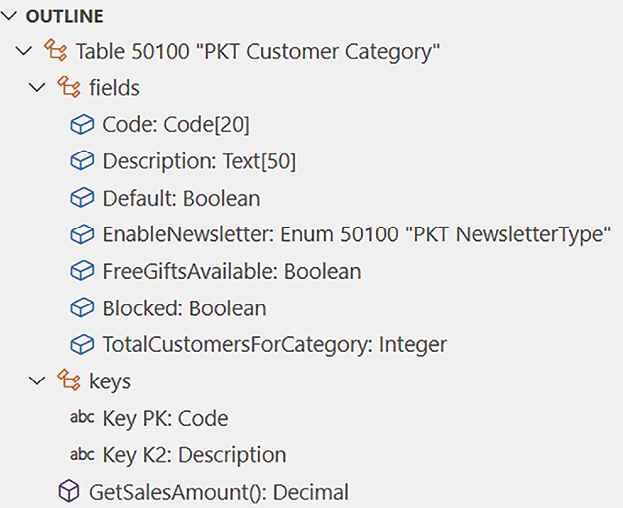
Figure 2.9: OUTLINE tree view
This is a proficient option when you are developing complex objects and you want to jump into a specific area with just one click.
SEARCH (Ctrl + Shift + F)
This is a powerful tool for searching for and replacing text in files. It is possible to opt for a simple search with one or more keywords, and you can use wildcards such as * and ?. Alternatively, you can opt for creating a complex search based on regular expressions (regexes). There are also advanced options to include and/or exclude files or file types.
If you would like to learn more about regexes in Visual Studio Code, the following video is a must-watch, 20230320 - RegEx - basic and advanced scenarios: https://www.youtube.com/watch?v=8qEHfD-QkXk.
The SEARCH action bar is helpful for developers when searching the Where used field or variables in all files within an extension folder. Take a look at the following screenshot:
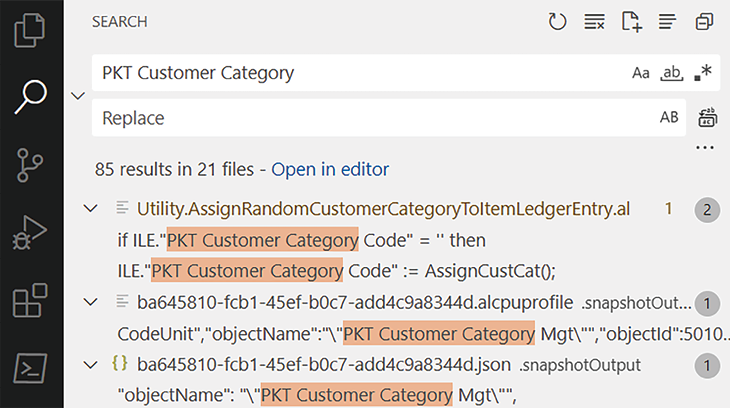
Figure 2.10: Searching extension files
Search outputs are listed in a tree view that lists all files containing the search keyword and shows a small piece of code related to the line that they belong to in the file. The keyword match is highlighted in the tree-view, as well as within the code editor. These can all be collapsed by clicking the Collapse All button.
It is possible to reset the search results by clicking the Clear Search Results button. It is also possible to turn sensitivity on/off and switch to regex view.
SOURCE CONTROL (Ctrl + Shift + G)
Visual Studio Code provides native integration with one of the most widely known source control management systems: Git. The basics and integration of Git will be discussed in Chapter 15, DevOps for Business Central.
DEBUG (Ctrl + Shift + D)
Visual Studio Code is not just a code editor for editing flat files. It also ships with an out-of-the-box integrated debugger framework that can be extended to debug different platforms and languages.
Visual Studio Code does not provide any debugging capability for Dynamics 365 Business Central per se. This comes embedded in the AL Language extension for Visual Studio Code, which extends the existing .NET core debugger. In Chapter 10, Debugging, we will discuss this argument in great detail.
EXTENSIONS (Ctrl + Shift + X)
The EXTENSIONS sidebar is used to browse the online marketplace for extensions for Visual Studio Code, which includes an ever-growing number of additional languages, debuggers, tools, helpers, and much more. AL Language is an extension for Visual Studio Code developed, maintained, and published by Microsoft. In the Visual Studio Code marketplace, you can also download several helpful extensions that extend (extensions for an extension) the AL Language extension and help Dynamics 365 Business Central developers be more efficient and productive and write code professionally and more proficiently. Take a look at the following screenshot, which shows typical Visual Studio Code extensions installed for Dynamics 365 Business Central:
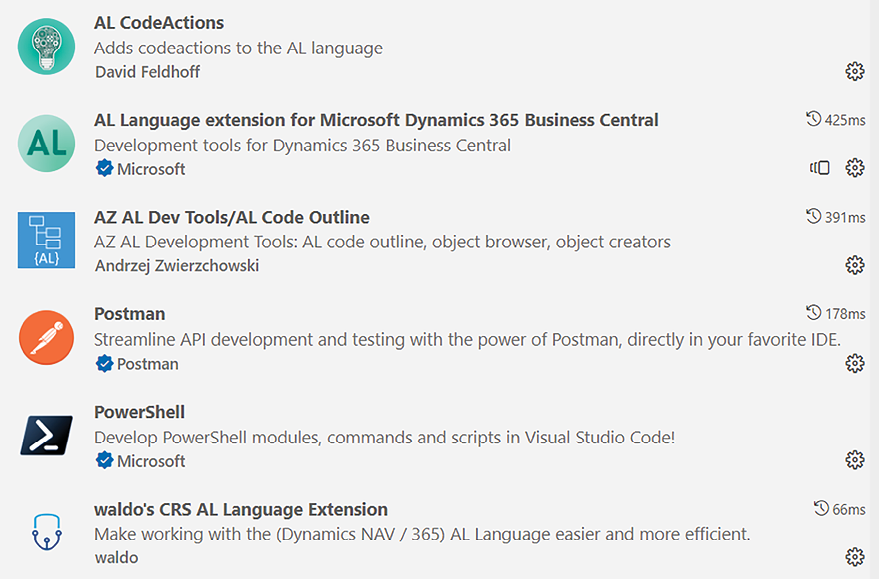
Figure 2.11: Extensions in Business Central
In the EXTENSIONS bar, it is possible to search the online marketplace or install an extension manually. You can also see the list of installed, outdated, recommended, and disabled extensions and sort them according to different criteria.
Some extension packages are meant to download and install a set of extensions. With Dynamics 365 Business Central, you might think of downloading and installing AL Extension Pack from https://marketplace.visualstudio.com/items?itemName=waldo.al-extension-pack or SD Extension Pack for Dynamics 365 Business Central from https://marketplace.visualstudio.com/items?itemName=StefanoDemiliani.sd-extpack-d365bc.
It is also possible to perform actions on a single extension by right-clicking on it. An extension can be enabled, disabled, disabled per workspace (a workspace could be a project or a folder), and so on. There are also a couple of cool features related to Visual Studio Code extension deployments that are worth mentioning. The first is the ability to install another version of the extension (for example, click on the gear icon in the AL Language extension and choose Install Another Version…):
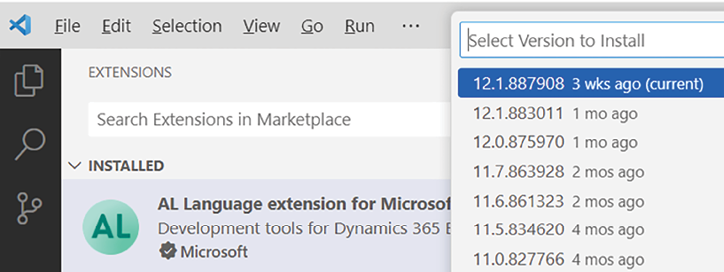
Figure 2.12: Installing extension versions
The second is the ability to deploy a pre-release instead of the official version. See below the button to deploy the pre-release for the AL Language extension:

Figure 2.13: Deploying a pre-release
This is very useful for Dynamics 365 Business Central developers, in case there are regression behaviors or bugs in higher-AL Language extension versions or the official release version. This is also useful when developments target a specific platform version.
Panels area
Visual Studio Code not only shows detailed analysis and information related to your code but also has access and display information coming from other sources such as Git, installed extensions, and debuggers. These outputs are logged into the Panels area, which, by default, is at the bottom, but could be easily moved to one side of the workspace using the Move Panel Right button, enabled by right-clicking on the panel’s title bar. It is possible to restore the original layout with the Move Panel to Bottom button, or even Hide Panel (Ctrl + J).
The Panels area is not visible by default. It is typically enabled and shown when the information needed is requested, such as when the debugger is enabled.
In the Panels area, there are four different windows (even though some extensions might add their own panels, such as GitLens): PROBLEMS, OUTPUT, DEBUG CONSOLE, and TERMINAL. Let’s examine them in the following sections.
PROBLEMS
With extension languages that have advanced editing features, such as AL, Visual Studio Code is able to identify code problems while typing. Problem lines have a specific colorization. There are three types of notifications: errors, warnings, and info. All of them can be shown in the PROBLEMS window. The following screenshot shows an example of the PROBLEMS window showing 4 errors and 3 warnings:

Figure 2.14: PROBLEMS window warnings
Typically, blocking errors are shown in red, while warnings are marked in yellow. Clicking any problem will open the file where the problem occurs, and the code that causes the problem will then be marked with a squiggly line in the problem color.
OUTPUT
The OUTPUT panel is the place where Visual Studio Code typically displays messages during or after command execution.
Because built-in tool actions and multiple extension commands can run concurrently, it is possible to make use of a drop-down box in the OUTPUT panel to change the view and see the output for each standard or extension-based command.
The following screenshot shows the OUTPUT window in the Panels area:
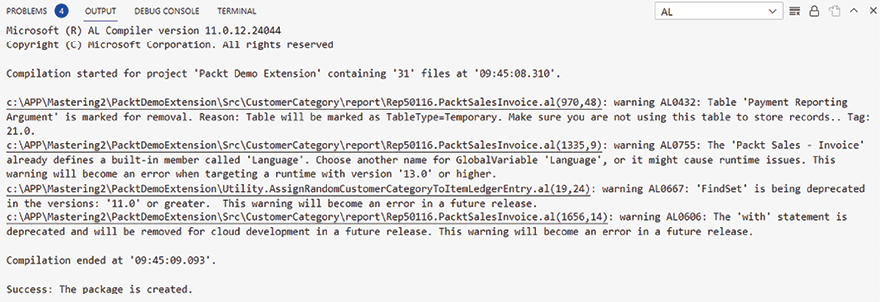
Figure 2.15: OUTPUT window messages
When working with Dynamics 365 Business Central extensions, the AL Language output window is selected automatically.
DEBUG CONSOLE
This is a special window used by native and extension-based debuggers, such as the AL language debugger, to display information about code execution. This window and its output will be analyzed in detail in Chapter 10, Debugging.
TERMINAL
Visual Studio Code allows us to execute commands in the same way as Command Prompt, directly from within the development environment. The Terminal session is based on PowerShell by default.
Now that we have all the elements that are related to Visual Studio Code in place, we can move on to the next section and deep-dive into the powerful editing features that it offers.


