Quick Start with JMeter
With JMeter, you can quickly run your first load test. This chapter will show you how to set up a simple test case with JMeter and its HTTP(S) Test Script Recorder element.
Our Process
Here are the steps to set up our test:
- Launch JMeter and prepare the recording of our script
- Configure the browser to use the HTTP(S) Test Script Recorder of JMeter
- Record the script
- Customize our script (add assertions, rename transactions, add think time…)
- Validate our script with a single user
- Configure the load test (define the number of users, number of iterations, warm-up duration, and load test duration…)
- Run and analyze the load test
Setup JMeter to Record Our Browsing Session
- Launch JMeter:

Figure 1.1: JMeter
- Use the Templates… feature of JMeter:

Figure 1.2: JMeter Templates… feature
- Choose Recording with Think Time model and click Create:

Figure 1.3: Recording template
- The test plan is ready:

Figure 1.4: Result of Recording template
- To save time in the future, we will select the HTTP Request Defaults element and fill in the Server Name or IP and Port Number sections:

Figure 1.5: Result of Recording template
Note
With this trick, we will share these two fields in every element HTTP Request Defaults and JMeter will not put them in each HTTP Request during recording.
Caution
During the load test, you should avoid having the injector (JMeter) on the same server as the application under test.
Otherwise, the injected load will be impacted by the application's bad performance, and the application could be impacted by the injector's bad performance.
Our tree is ready; we must now start the proxy server of JMeter.
But before doing that, let's look at the HTTP(S) Test Script Recorder element.
- For the name of recorded transactions, we have two options in Recorder:
Transaction name, which allows you to fully name them as you wish.
Prefix, which will just prepend the prefix to the default name given by JMeter, which is usually the URL path.

Figure 1.6: Transaction naming strategy
- Note that with the default configuration of the template, static resources (image, CSS file, JS file…) are not recorded:
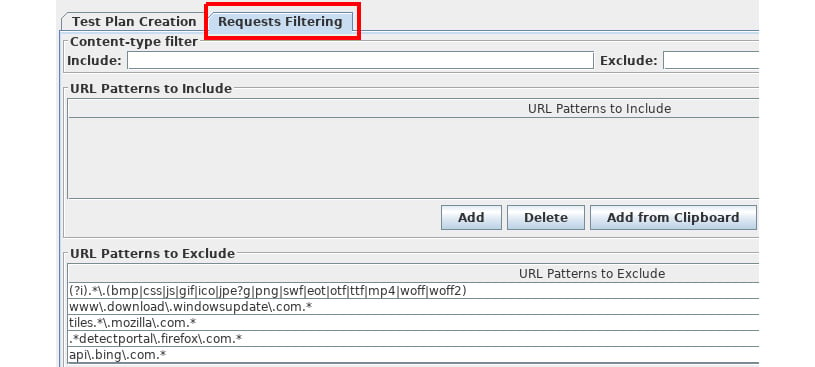
Figure 1.7: Exclude static resource capture
JMeter is now ready to record our navigation session.
Configure Your Browser
- In order for JMeter to record the navigation session, we must configure our browser to use the proxy server that JMeter launched.
- For example, with Firefox, choose the menu Edit > Preferences:

Figure 1.8: Proxy selection in Firefox
- Then select the Advanced tab and then the Network sub-tab. Let's click on Settings…:

Figure 1.9: Proxy selection in Firefox – Network
- In the new window, select the Manual proxy configuration option, then fill in the HTTP Proxy field with the following IP address: 127.0.0.1 (corresponding to the local IP address (localhost)), and fill in the Port field with 8888 (corresponding to the default listening port of the JMeter proxy server).
Caution
When recording a local application, be careful to delete localhost and 127.0.0.1 from the No Proxy for: field.
- Finally, check the Use this proxy server for all protocols box.
- Let's save the modifications by clicking on the OK button in the Firefox window:
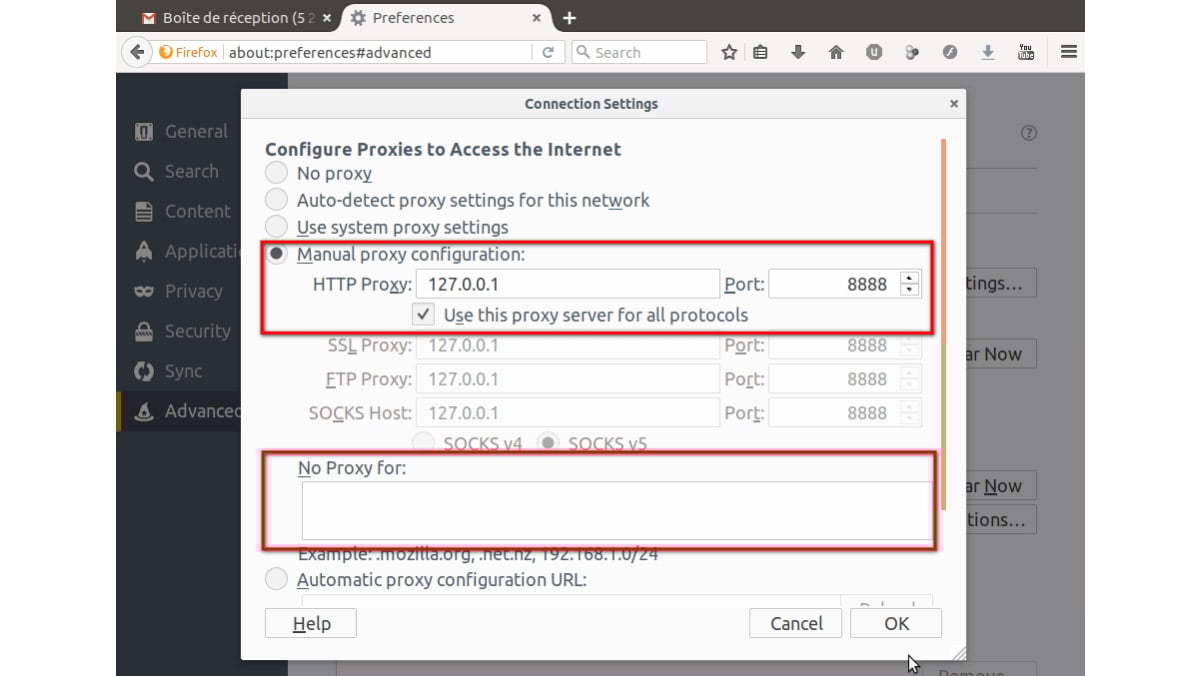
Figure 1.10: Proxy selection in Firefox – configuration
Save Our Script
Now, let's start our navigation session.
- To do this, simply click the Start button on the HTTP(S) Test Script Recorder element:

Figure 1.11: HTTP(S) Test Script Recorder
Note
Note that the default listening port of JMeter proxy server is 8888.
Note the first time you start the recorder, it takes more time as it generates a Certificate Authority that you can use to intercept HTTPS traffic.
- This will open a Recorder: Transactions Control window, allowing us to set in real time the name of each recorded step transactions and their grouping based on time:

Figure 1.12: Recorder: Transactions Control
- In this chapter, we will use the Request Parameters example delivered with Apache Tomcat.
From the browser, navigate to the website:
http://server:8080/examples/servlets/
In our case, it will be:
http://localhost:8080/examples/servlets/
Here is the first page:

Figure 1.13: First page of our scenario
- Then, click on the Execute link of the Required test servlet:

Figure 1.14: Request Parameters Example with no entries
Enter first and last name and click on Submit Query:

Figure 1.15: Request Parameters Example before submitting query
When the result appears, we can stop our navigation session:

Figure 1.16: Request Parameters Example after submitting query
- In JMeter, the scenario tree is the following:

Figure 1.17: Result of our recording in JMeter
- Let us observe what has been recorded:

Figure 1.18: Observation table
- As we can see, thanks to the trick of filling the Server Name or IP and Port Number sections of the HTTP Request Defaults element, these fields remain empty in the HTTP Request elements.
This will allow us to change the URL and port of the tested site in only one location (HTTP Request Defaults) if necessary (for example, if the script was run on a development environment, and the final test will run on the pre-production environment):

Figure 1.19: Result of filling in the Server Name or IP and Port Number sections of the HTTP Request Defaults element
- Similarly, the waiting time between each action (Think time) was recorded:

Figure 1.20: Recorded think time
- To make it easier to read the results, it is preferable to rename HTTP requests. The automatically chosen name, by default, corresponds to the called URI, but you can control it in the little popup and give it a meaningful name before clicking on the button that will issue the request(s).
The result of the renaming:

Figure 1.21: Renaming result
- As the last step to the development of the scenario, we are going to add assertions to each HTTP request. These will make it possible to verify that the response received is indeed the expected one.
- To do this, select the HTTP request that will receive the assertion, then, via the context menu, choose Add > Assertions > Response Assertion:

Figure 1.22: Add assertion
- A new Response Assertion element has been added as a child to the SC01_1 Homepage request.
- Let's select the following options:
Field to Test: Text Response
Pattern Matching Rules: Substring (default)
Patterns to Test: Let's click on the Add button, then insert text contained in the answer:

Figure 1.23: Assertion configuration
- To find what data we need to check in response, the trick is to use the View Results Tree element, located under our HTTP(S) Test Script Recorder, by choosing the desired request and then by selecting the tab Response data > Response Body.
- We can then copy the text and use Add from clipboard button in the Response Assertion:

Figure 1.24: Result in Results Tree
- Repeat the operation for all the requests in the same way as you did for the home page.
In the end, we get this JMeter scenario tree:
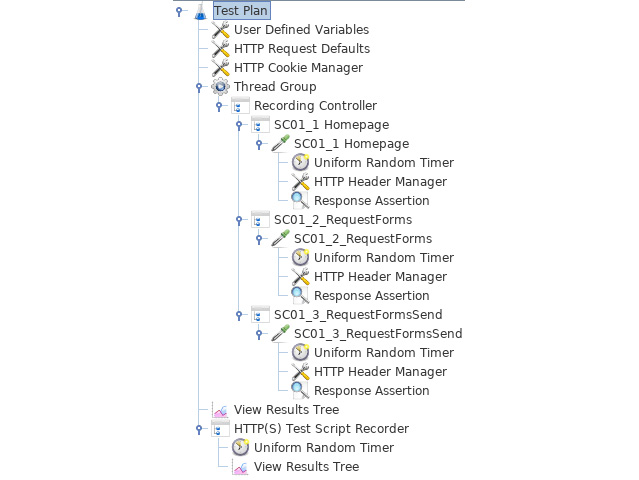
Figure 1.25: Our JMeter scenario
Now our scenario is ready, let's proceed to the validation of our script.
Validate Our Script with Only One User
- It's easy with the validation mode, as it allows us to execute our script with only one user, one iteration, and without pause time.
- To do this, let's select the Thread Group that we want to test, right-click, and select Validate:

Figure 1.26: Validation of our script
- Validate in the View Results Tree element that all Sample Results are green. If that is the case, we can proceed to the configuration step of our load test.
Setup Our Load Test and Launch It
- To set up our load test, select the Thread Group element in order to change the following values:
Number of Threads (users): 10
Ramp-Up Period (in seconds): 10
Loop Count: 100
This gives 10 virtual users (VU) who arrive in 10 seconds (1 per second), and each one will make 100 executions of the query sequence.

Figure 1.27: Load test parameters
Caution
Several strategies for setting the load test exists. This point will be discussed deeply in Chapter 2, JMeter Overview.
- We could run our load test directly from the JMeter GUI, but this is not recommended as it would not be optimal for performances of injection (although, in our case, with only 10 users, it shouldn't be a problem).
- When load testing, it is advisable to monitor the injectors (servers where JMeter runs) at least during the first test at full load to validate the correct behavior of the injectors.
This ensures that if we get bad response times, the cause is the application being tested and not JMeter.
Note that this is not specific to JMeter but should be done regardless of the tool you use.
Note
An easy and quick solution to monitor JMeter can be to use the Servers Performance Monitoring plugin from the JMeter Plugins (https://jmeter-plugins.org/wiki/PerfMon/).
- So, let's use best practices directly and run our test from the command line in CLI mode (also called Non-GUI mode in JMeter).
- But before that, to follow our test in real time, we will add the Backend Listener element to enable live monitoring of the progress of the test with Grafana (https://grafana.com/).
- To do this, right-click on Test Plan -> Add -> Listener -> Backend Listener:

Figure 1.28: Add Backend Listener
- Let's configure it to send the test results to our InfluxDB database (https://www.influxdata.com/):
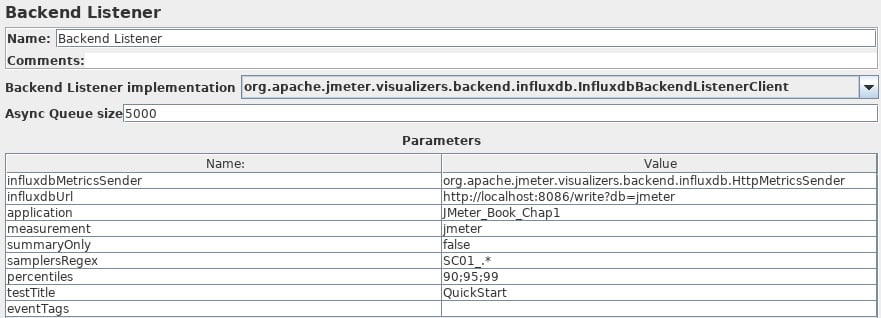
Figure 1.29: Backend Listener configuration
Note
In the samplersRegex field, we can use a regular expression to keep only the queries that were recorded by the HTTP(S) Test Script Recorder element (thanks to Prefix: field).
Run Our Load Test and Analyze It
- Before launching our test, one last tip is to ask JMeter to generate an HTML report at the end.
For this, we will use the following command line:
<JMETER_HOME>/bin/jmeter -n -t [jmx file] -l [results file] -e -o [Path\ to output folder]
- Let's run our test and see what happens.
In our terminal:

Figure 1.30: Follows a load test in the terminal
- In Grafana (the dashboard used is one of those proposed in the Grafana website (https://grafana.com/dashboards/3351)):
Note
We can use this dashboard, too: https://grafana.com/dashboards/5496.

Figure 1.31: Real-time monitoring in Grafana

Figure 1.32: Real-time monitoring in Grafana
- At the end of our test, we get the HTML dynamic Web Report with 17 graphs, an APDEX (https://en.wikipedia.org/wiki/Apdex) table, a statistics table (showing response times, error rates, network metrics…), a table with an errors summary, and a table with Top5errors per sampler. So, you get everything you need to analyze your load test:
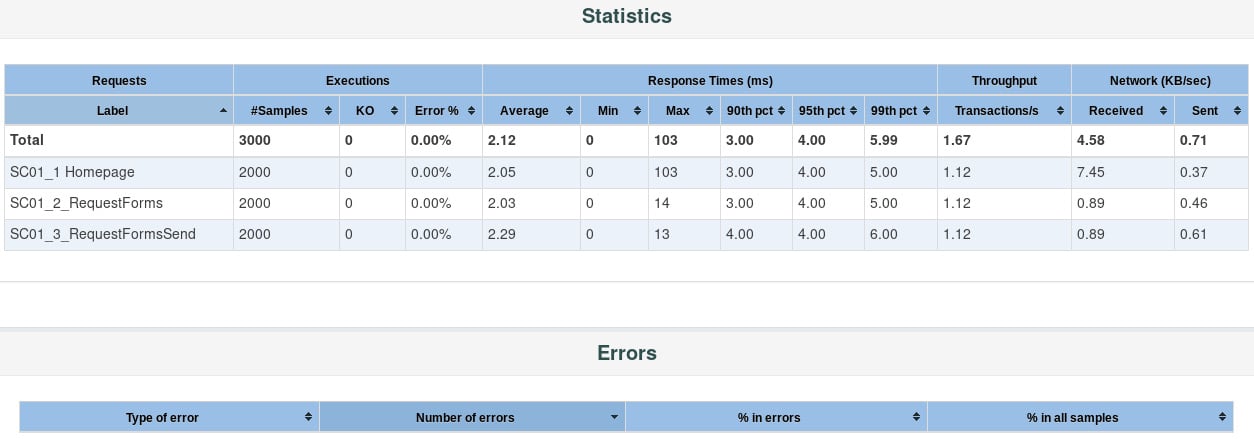
Figure 1.33: HTML report
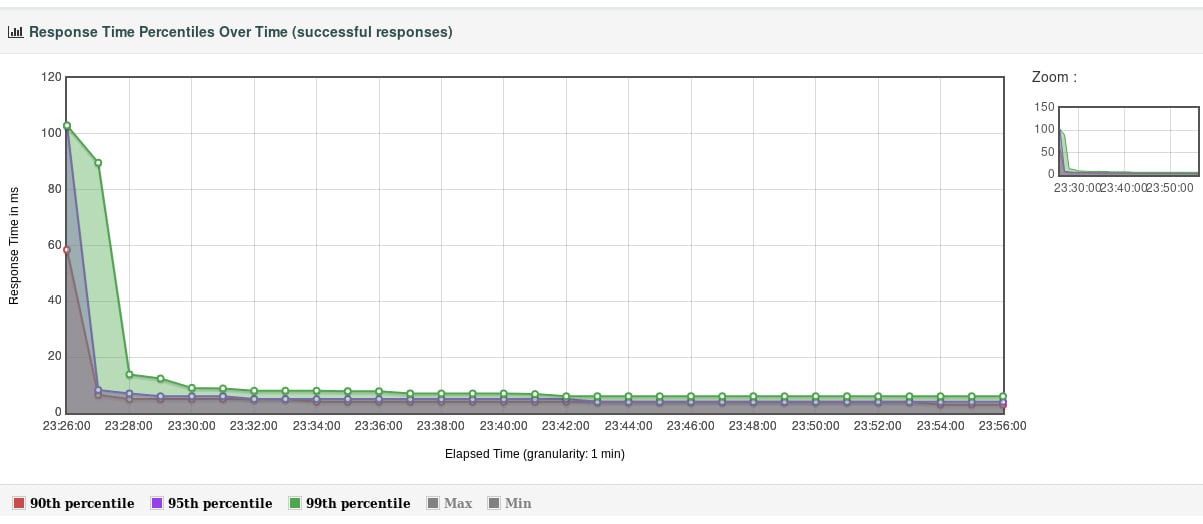
Figure 1.34: HTML report
The icing on the cake is a CSV file we get at the end of our test; this format is usable by many tools to visualize the results differently.
In this chapter, we have seen how to quickly get started with JMeter to perform a simple load test.


