Search icon CANCEL
Subscription
0
Cart icon
Your Cart (0 item)
Close icon
You have no products in your basket yet
Save more on your purchases! discount-offer-chevron-icon
Savings automatically calculated. No voucher code required.
Arrow left icon
Explore Products
Best Sellers
New Releases
Books
Videos
Audiobooks
Learning Hub
Free Learning
Arrow right icon
Arrow up icon
GO TO TOP
Mastering Ubuntu Server

You're reading from   Mastering Ubuntu Server Explore the versatile, powerful Linux Server distribution Ubuntu 22.04 with this comprehensive guide

Arrow left icon
Product type Paperback
Published in Sep 2022
Publisher Packt
ISBN-13 9781803234243
Length 584 pages
Edition 4th Edition
Tools
Concepts
Arrow right icon
Author (1):
Arrow left icon
Jay LaCroix Jay LaCroix
Author Profile Icon Jay LaCroix
Jay LaCroix
Arrow right icon
View More author details
Toc

Table of Contents (26) Chapters Close

Preface 1. Deploying Ubuntu Server 2. Managing Users and Permissions FREE CHAPTER 3. Managing Software Packages 4. Navigating and Essential Commands 5. Managing Files and Directories 6. Boosting Your Command-line Efficiency 7. Controlling and Managing Processes 8. Monitoring System Resources 9. Managing Storage Volumes 10. Connecting to Networks 11. Setting Up Network Services 12. Sharing and Transferring Files 13. Managing Databases 14. Serving Web Content 15. Automating Server Configuration with Ansible 16. Virtualization 17. Running Containers 18. Container Orchestration 19. Deploying Ubuntu in the Cloud 20. Automating Cloud Deployments with Terraform 21. Securing Your Server 22. Troubleshooting Ubuntu Servers 23. Preventing Disasters 24. Other Books You May Enjoy
25. Index

Understanding the ps command

While managing our server, we’ll need to understand what processes are running and how to manage them. Later in this chapter, we’ll work through starting, stopping, and monitoring processes. But before we get to those concepts, we first need to be able to determine what is actually running on our server. The ps command allows us to do this.

Viewing running processes with ps

When executed by itself, the ps command will show a list of processes run by the user who called the command:
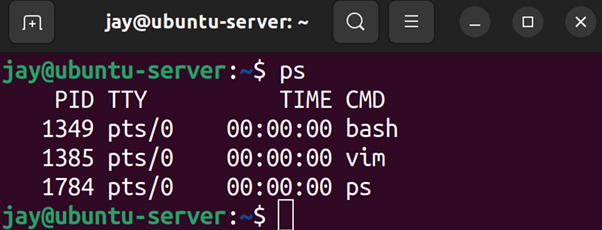
Figure 7.2: The output of the ps command, when run as a normal user and with no options

In Figure 7.2, you can see that when I ran the ps command as my own user with no options, it showed me a list of processes that I am running as myself. In this case, I have a vim session open (running in the background), and in the last line, we also see ps itself, which is also included in the output.

On the left side of the output, you’ll see a number for each of the running processes. This is known as the Process ID (PID), which we mentioned in the Managing jobs section. Before we continue on, the PID is something that you really should be familiar with, so we may as well cover it right now.

Each process running on your server is assigned a PID, which differentiates it from other processes on your system. You may understand a process as vim, or top, or some other name. However, our server knows processes by their ID. When you open a program or start a process, it’s given a PID by the kernel. As you work on managing your server, you’ll find that the PID is useful to know, especially for the commands we’ll be covering in this very chapter. If you want to kill a misbehaving process, for example, a typical workflow would be for you to find the PID of that process and then reference that PID when you go to kill the process (which I’ll show you how to do in a later section). PIDs are actually more complex than just a number assigned to running processes, but for the purposes of this chapter, that’s the main purpose we’ll need to remember.

You can also use the pidof command to find the PID of a process if you know the name of it. For example, I showed you a screenshot of a vim process running with a PID of 1385. You can also do so by running the following command:

pidof vim 

The output will give you the PID(s) of the process without you having to use the ps command.

Configuring arguments to ps

Continuing with the ps command, there are several useful arguments you can give in order to change the way in which it produces an output. If you use the a option, you’ll see more information than you normally would:

ps a 

This will produce an output something like the following:

Figure 7.3: The output of the ps a command

With ps a, we’re seeing the same output as before, but with additional information, as well as column headings at the top. We now see a heading for PID, TTY, STAT, TIME, and COMMAND. From this new output, you can see that the vim processes I have running are editing a file named testfile.txt. This is great to know, because if I had more than one vim session open and one of them was misbehaving, I would probably want to know which one I specifically needed to stop.

We already saw the PID and COMMAND fields, although we didn’t see a formal heading at the top. The PID column we’ve already covered, so I won’t go into any additional detail about that. The COMMAND field tells us the actual command being run, which is very useful if we either want to ensure we’re managing the correct process or to see what a particular user is running (I’ll demonstrate how to display processes for other users soon).

The STAT, field is new; we didn’t see it when we ran ps by itself. The STAT field gives us the status code of the process, which refers to which state the process is currently in. The state can be uninterruptible sleep (D), defunct (Z), stopped (T), interruptible sleep (S), and in the run queue (R). There is also paging (W), but that is not used anymore, so there’s no need to cover it. Uninterruptible sleep is a state in which a process is generally waiting on input and cannot handle additional signals (we’ll briefly talk about signals later on in this chapter). A defunct process (also referred to as a zombie process) has, for all intents and purposes, finished its job but is waiting on the parent to perform cleanup. Defunct processes aren’t actually running, but remain in the process list and should normally close on their own. If such a process remains in the list indefinitely and doesn’t close, it can be a candidate for the kill command, which we will discuss later. A stopped process is generally a process that has been sent to the background, which will be discussed in the next section. Interruptible sleep means that the program is idle: it’s waiting for input in order to awaken.

The TTY column tells us which TTY the process is attached to. A TTY refers to a teletypewriter, which is a term used from a much different time period. In the past, during the time of big mainframes, users would use such computers using “terminals” – a device consisting of a monitor and keyboard, connected (via the wire) to the mainframe. Such devices could only display the output received from the mainframe, and receive data typed on the keyboard. Teletypewriter was the term used to refer to such devices. Obviously, we don’t use machines like these nowadays, but the concept is similar from a virtual standpoint.

On our server, we’re using our keyboard to send input to a device that then displays output to another device. In our case, the input device is our keyboard and the output device is our screen, which is either connected directly to our server or is located on our computer, which is connected to our server over a service such as SSH. On a Linux system, most processes run on a TTY, which is (for all intents and purposes) a terminal that grabs input and manages the output, similar to a teletypewriter in a virtual sense. A terminal is our method of interacting with our server.

In Figure 7.3, we have a process running on a TTY of tty1, and the other processes are running on pts/0. The TTY we see is the actual terminal device, and pts references a virtual (pseudo) terminal device. Our server is actually able to run several tty sessions, typically one to seven. Each of these can be running its own programs and processes. To understand this better, try pressing Ctrl + Alt + any function key, from F1 through F7 (if you have a physical keyboard plugged into a physical server). Each time, you should see your screen cleared and then moved to another terminal. Each of these terminals is independent of one another. Each of your function keys represents a specific TTY, so by pressing Ctrl + Alt + F6, you’re switching your display to TTY 6.

Essentially, you’re switching from TTY 1 through to TTY 7, with each being able to contain its own running processes. If you run ps a again, you’ll see any processes you start on those TTYs show up in the output as a tty session, such as tty2 or tty4. Processes that you start in a terminal emulator will be given a designation of pts, because they’re not running in an actual TTY, but rather a pseudo-TTY.

This was a long discussion for something that ends up being simple (TTY or pseudo-TTY), but with this knowledge, you should be able to differentiate between a process running on the actual server or through a shell.

Continuing, let’s take a look at the TIME field of our ps command output. This field represents the total amount of time the CPU has been utilized for that particular process. However, the time is 0:00 for each of the processes in the screenshot I’ve provided. This may be confusing at first. In my case, the vim processes in particular have been running for about 15 minutes or so since I took the screenshot, and they still show 0:00 utilization time even now. Actually, this isn’t the amount of time the process has been running, but rather the amount of time the process has been actively engaging with the CPU. In the case of vim, each of these processes is just a buffer with a file open. For the sake of comparison, the Linux machine I’m writing this chapter on has a process ID of 759 with a time of 92:51. PID 759 belongs to my X server, which provides the foundation for my graphical user interface (GUI) and windowing capabilities. However, this laptop currently has an uptime of 6 days and 22 hours as I type this, which is roughly equivalent to 166 hours, which is not the same amount of time that PID 759 is reporting in its TIME entry. Therefore, we can deduce that even though my laptop has been running for 6 days straight, the X server has only utilized 92 hours and 51 minutes of actual CPU time. In summary, the TIME column refers to the amount of time a process needs the CPU in order to calculate something and is not necessarily equal to how long something has been running, or for how long a graphical process is showing on your screen.

Let’s continue on with the ps command and look at some additional options. First, let’s see what we get when we add the u option to our previous example, which gives us the following example command:

ps au

This will produce an output that will look similar to the following:

Figure 7.4: The output of the ps au command

When you run it, you should notice the difference from the ps a command right away. With this variation, you’ll see processes listed that are being run by your user ID, as well as other users. When I run it, I see processes listed in the output for my user (jay), as well as one for root. The u option will be a common option you’re likely to use, since most of the time while managing servers, you’re probably more interested in keeping an eye on what kinds of shenanigans your users are getting themselves into. But perhaps the most common use of the ps command is the following variation:

ps aux 

With the x option added, we’re no longer limiting our output to processes within a TTY (either native or pseudo). The result is that we’ll see a lot more processes, including system-level processes that are not tied to a process we started ourselves. Go ahead and try it. In practice, though, the ps aux command is most commonly used with grep to look for a particular process or string. For example, let’s say you want to see a list of all nginx worker processes. To do that, you may execute a command such as the following:

ps aux | grep nginx 

Here, we’re executing the ps aux command as before, but we’re piping the output into grep, where we’re looking only for lines of output that include the string nginx. In practice, this is the way I often use ps, as well as the way I’ve noticed many other administrators using it. With ps aux, we are able to see a lot more output, and then we can narrow that down with search criteria by piping into grep. However, if all we wanted to do was to show processes that have a particular string, we could also do the following:

ps u -C nginx 

This would produce output containing a list of processes matching nginx, and related details. Another useful variation of the ps command is to sort the output by sorting the processes using the most CPU first:

ps aux --sort=-pcpu 

Unfortunately, that command shows a lot of output, and we would have to scroll back to the top in order to see the top processes. Depending on your terminal, you may not have the ability to scroll back very far (or at all), so the following command will narrow it down further:

ps aux --sort=-pcpu | head -n 5 

Now that is useful! With that example, I’m using the ps aux command with the --sort option, sorting by the percentage of CPU utilization (-pcpu). Then I’m piping the output into the head command, where I’m instructing it to show me only five lines (-n 5). Essentially, this is giving me a list of the top five processes that have used the most CPU since boot time. In fact, I can do the same, but with the most-used memory instead:

ps aux --sort=-pmem | head -n 5 

If you want to determine which processes are misbehaving and using a non-ordinary amount of memory or CPU, those commands will help you narrow it down. The ps command is a very useful command for your admin toolbox. Feel free to experiment with it beyond the examples I’ve provided; you can consult the man pages for the ps command to learn even more tricks. In fact, the second section of the man page for ps (under examples) gives you even more neat examples to try out.

Now that we know how to inspect running processes, in the next section, we’ll take a look at how to change the priority of the processes to ensure those that are more important are given extra attention by the CPU.

lock icon The rest of the chapter is locked
Register for a free Packt account to unlock a world of extra content!
A free Packt account unlocks extra newsletters, articles, discounted offers, and much more. Start advancing your knowledge today.
Unlock this book and the full library FREE for 7 days
Get unlimited access to 7000+ expert-authored eBooks and videos courses covering every tech area you can think of
Renews at $19.99/month. Cancel anytime
Banner background image