


In this recipe, we will continue from the last recipe and create a dashboard by using this data model. Use this excel file as a data source to build your Power BI tile.
Integrating Excel with Power BI
How to do it...
- Log in to http://app.powerbi.com using your organization credentials. For first time users, you can sign up for a trial version:
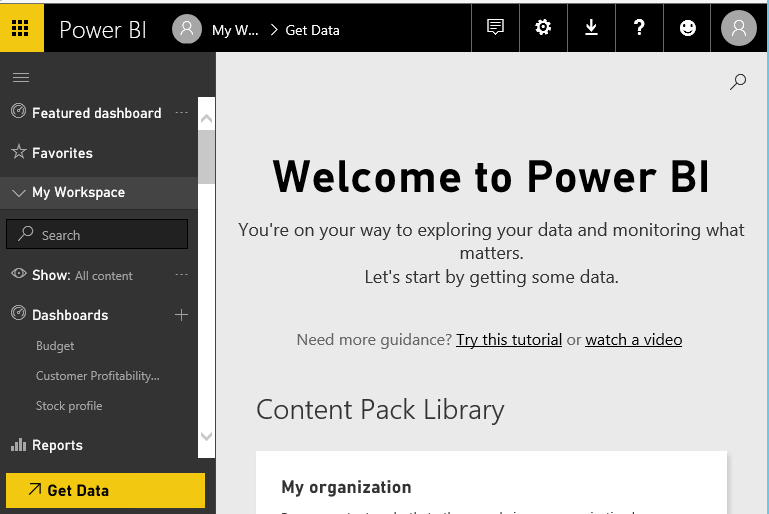
- Create a new dashboard by clicking on the plus sign (+) next to Dashboards. Enter the name as vendor payment.
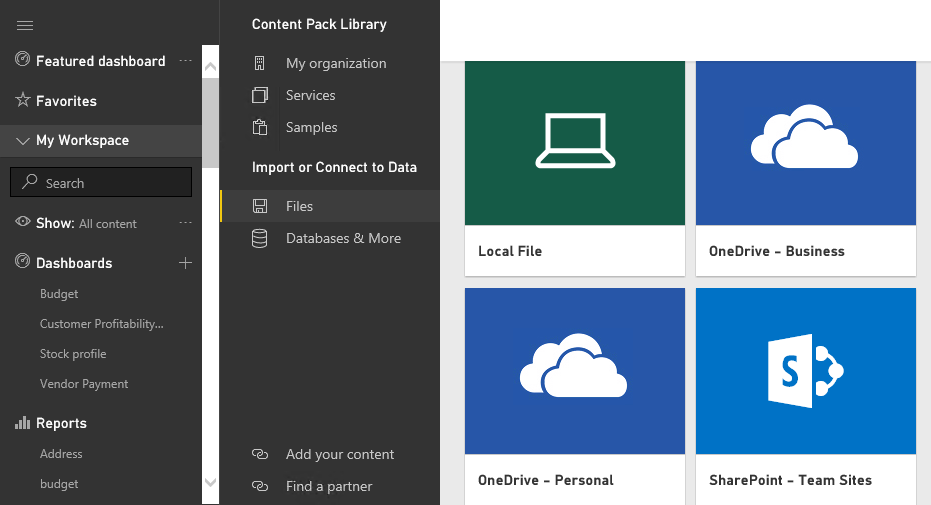
- Click on GetData and under the Files tile click on select Local File and load your excel file and then import it into Power BI:
- On successful import your dashboard should look like this:
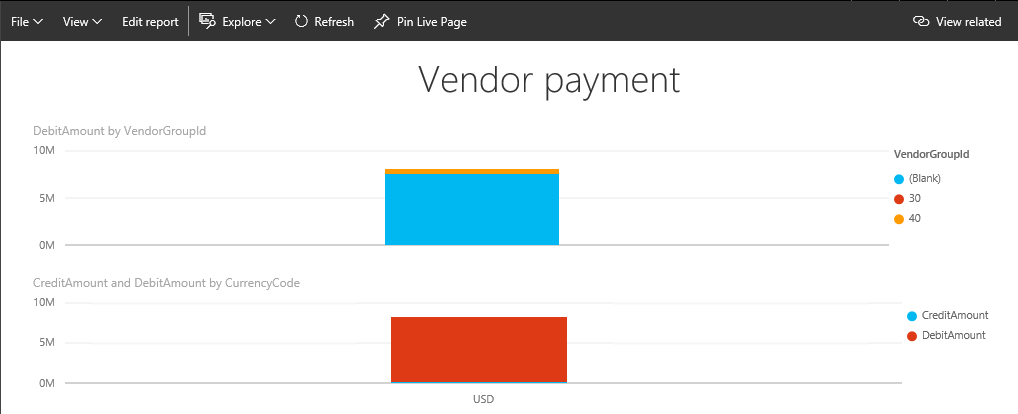
Save your setup.
- Now you will be able to use this Power BI tile in Dynamics 365...