Search icon CANCEL
Subscription
0
Cart icon
Your Cart (0 item)
Close icon
You have no products in your basket yet
Arrow left icon
Explore Products
Best Sellers
New Releases
Books
Videos
Audiobooks
Learning Hub
Free Learning
Arrow right icon
Arrow up icon
GO TO TOP
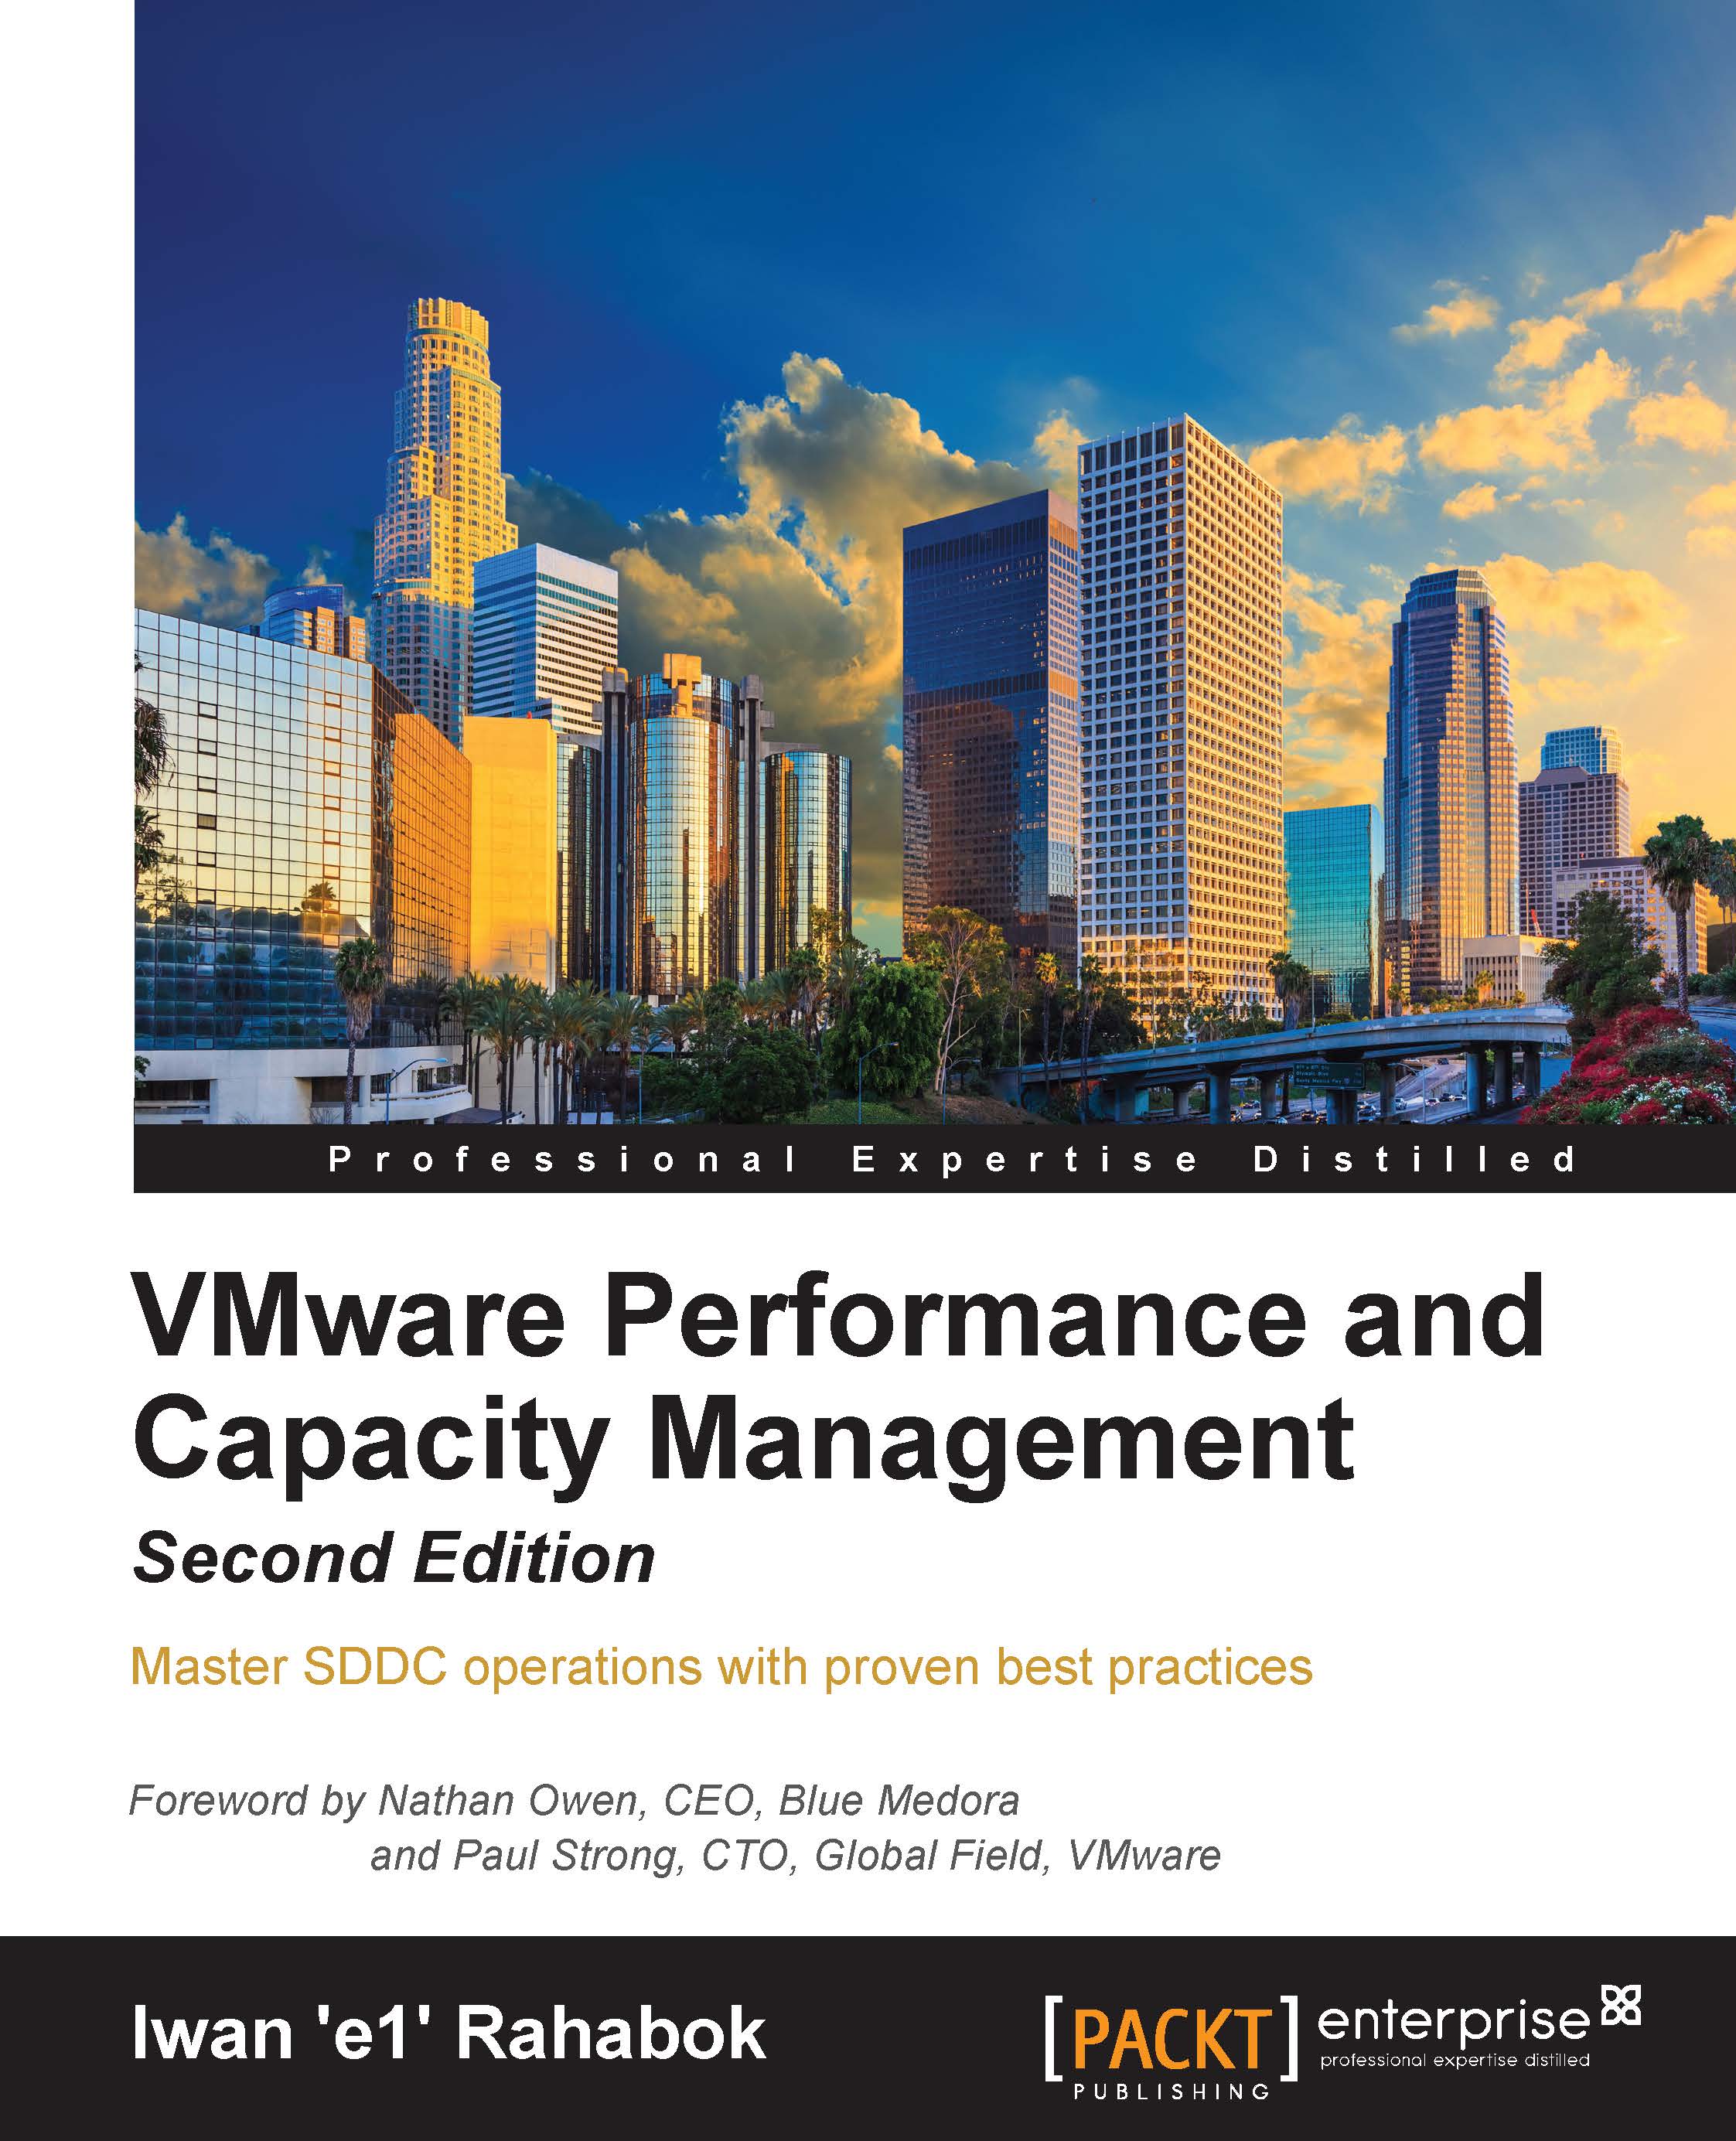
VMware Performance and Capacity Management, Second Edition

You're reading from   VMware Performance and Capacity Management, Second Edition Master SDDC Operations with proven best practices

Arrow left icon
Product type Paperback
Published in Mar 2016
Publisher
ISBN-13 9781785880315
Length 546 pages
Edition 2nd Edition
Tools
Arrow right icon
Authors (2):
Arrow left icon
Sunny Dua Sunny Dua
Author Profile Icon Sunny Dua
Sunny Dua
Iwan 'e1' Rahabok Iwan 'e1' Rahabok
Author Profile Icon Iwan 'e1' Rahabok
Iwan 'e1' Rahabok
Arrow right icon
View More author details
Toc

Table of Contents (20) Chapters Close

Preface Part 1
1. VM – It Is Not What You Think! FREE CHAPTER 2. Software-Defined Data Centers 3. SDDC Management 4. Performance Monitoring 5. Capacity Monitoring Part 2
6. Performance-Monitoring Dashboards 7. Capacity-Monitoring Dashboards 8. Specific-Purpose Dashboards 9. Infrastructure Monitoring Using Blue Medora 10. Application Monitoring Using Blue Medora Part 3
11. SDDC Key Counters 12. CPU Counters 13. Memory Counters 14. Storage Counters 15. Network Counters Index

Dashboards for the VDI team

Chapter 5, Capacity Monitoring, explains that VDI scope is wider than server workload. Besides the IaaS component, you need to monitor Windows VMs and the VDI servers. VDI is more than vSphere + Horizon. Here are the common areas that you need to monitor:

Dashboards for the VDI team

Components to monitor in VMware Horizon

This results in more dashboards and the need for additional monitoring tools and adapters. Let's look at two common use cases in this book.

Is the DaaS serving the user well?

vRealize Operations provides in-Guest visibility and application-specific counters for VDI. This enables you to track performance at more points. In fact, there are 12 metrics you can check to ensure that your DaaS platform is indeed serving the VDI user well.

The article at http://virtual-red-dot.info/12-kpis-for-high-performance-vdi covers the details, so we will summarize them here.

The 12 metrics used as KPIs are as follows:

Component

Metric

Threshold

CPU

Contention

2%

CPU

Workload

70...

lock icon The rest of the chapter is locked
Register for a free Packt account to unlock a world of extra content!
A free Packt account unlocks extra newsletters, articles, discounted offers, and much more. Start advancing your knowledge today.
Unlock this book and the full library FREE for 7 days
Get unlimited access to 7000+ expert-authored eBooks and videos courses covering every tech area you can think of
Renews at $19.99/month. Cancel anytime
Banner background image