Search icon CANCEL
Subscription
0
Cart icon
Your Cart (0 item)
Close icon
You have no products in your basket yet
Arrow left icon
Explore Products
Best Sellers
New Releases
Books
Videos
Audiobooks
Learning Hub
Free Learning
Arrow right icon
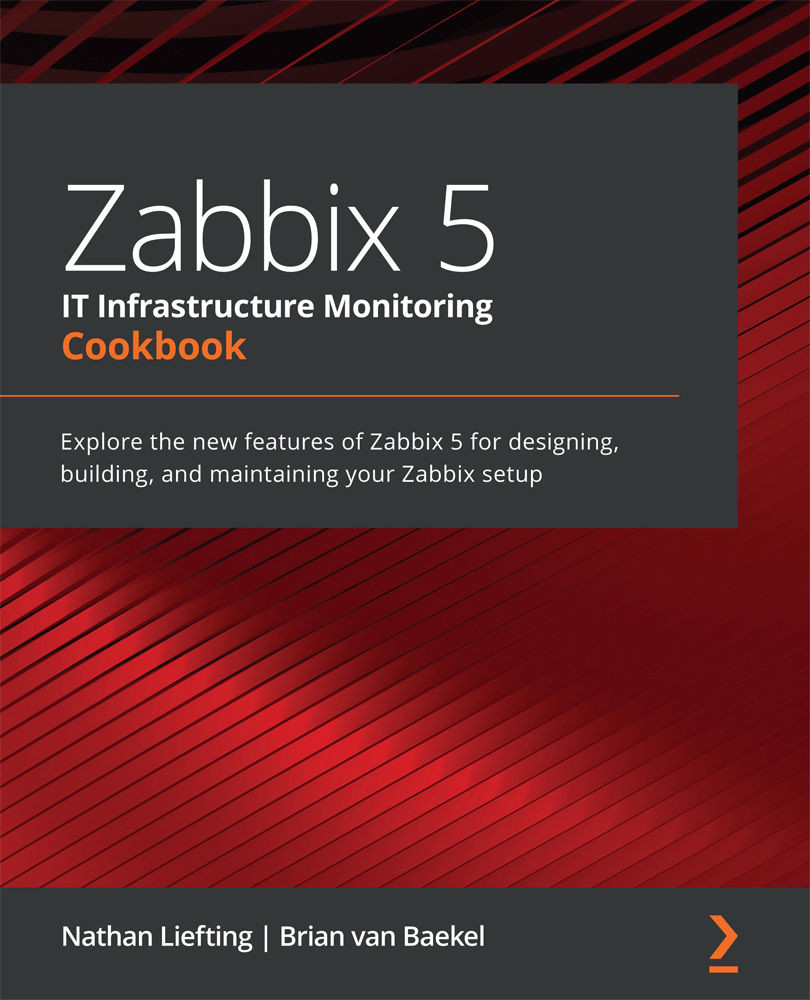
Zabbix 5 IT Infrastructure Monitoring Cookbook

Zabbix 5 IT Infrastructure Monitoring Cookbook: Explore the new features of Zabbix 5 for designing, building, and maintaining your Zabbix setup

Arrow left icon
Profile Icon Nathan Liefting Profile Icon Baekel
Arrow right icon
$48.99
Full star icon Full star icon Full star icon Full star icon Full star icon 5 (3 Ratings)
Paperback Feb 2021 428 pages 1st Edition
eBook
$24.99 $35.99
Paperback
$48.99
Subscription
Free Trial
Renews at $19.99p/m
Arrow left icon
Profile Icon Nathan Liefting Profile Icon Baekel
Arrow right icon
$48.99
Full star icon Full star icon Full star icon Full star icon Full star icon 5 (3 Ratings)
Paperback Feb 2021 428 pages 1st Edition
eBook
$24.99 $35.99
Paperback
$48.99
Subscription
Free Trial
Renews at $19.99p/m
eBook
$24.99 $35.99
Paperback
$48.99
Subscription
Free Trial
Renews at $19.99p/m

What do you get with Print?

Product feature icon Instant access to your digital eBook copy whilst your Print order is Shipped
Product feature icon Paperback book shipped to your preferred address
Product feature icon Download this book in EPUB and PDF formats
Product feature icon Access this title in our online reader with advanced features
Product feature icon DRM FREE - Read whenever, wherever and however you want
Product feature icon AI Assistant (beta) to help accelerate your learning
OR
Modal Close icon
Payment Processing...
tick Completed

Shipping Address

Billing Address

Shipping Methods
Table of content icon View table of contents Preview book icon Preview Book

Zabbix 5 IT Infrastructure Monitoring Cookbook

Chapter 2: Setting Up Zabbix Monitoring

Zabbix is built to be flexible and should be able to monitor just about anything you could ever require. In this chapter, we will learn more about working with Zabbix to build a lot of different options for monitoring. We'll go over them recipe by recipe, so you'll end up with a solid understanding of how they work. We'll cover the following recipes on the different monitoring types:

  • Setting up Zabbix agent monitoring
  • Working with SNMP monitoring
  • Creating Zabbix simple checks and Zabbix trapper
  • Working with calculated and dependent items
  • Creating external checks
  • Setting up JMX monitoring
  • Setting up database monitoring
  • Setting up HTTP agent monitoring
  • Using Zabbix preprocessing to alter item values

Technical requirements

We will need a Zabbix server capable of performing monitoring, with the following requirements:

  • A server with Zabbix server installed on a Linux distribution of your choice, such as CentOS or Ubuntu, but a distribution such as Debian or anything else will suit you just as well
  • MariaDB set up to work with your Zabbix server
  • NGINX or Apache set up to serve the Zabbix frontend

I'll be using the same server as we used in the previous chapter, but any Zabbix server should do.

Setting up Zabbix agent 2 monitoring

With the release of Zabbix 5, Zabbix also officially started support for the new Zabbix agent 2. Zabbix agent 2 brings some major improvements and is even written in another coding language, which is Golang instead of C. In this recipe, we will be exploring how to work with Zabbix agent 2 and explore some of the new features introduced by it.

You'll also need a Linux distribution of your choice running Zabbix agent 2.

Getting ready

To get started with Zabbix agent 2, all we need to do is install it to a (Linux) host that we want to monitor. Make sure you have an empty Linux (CentOS 8) host ready to monitor.

How to do it

Let's see how to install Zabbix agent 2 and then move on to actually working with it.

Installing Zabbix agent 2

Let's start by installing Zabbix agent 2 on the Linux host we want to monitor. I'll be using a CentOS 8 machine:

  1. Issue the following command to add the repository:

    For RHEL-based systems:

    rpm -Uvh https://repo.zabbix.com/zabbix/5.0/rhel/8/x86_64/zabbix-release-5.0-1.el8.noarch.rpm

    For Debian-based systems:

    wget https://repo.zabbix.com/zabbix/5.0/debian/pool/main/z/zabbix-release/zabbix-release_5.0-1+buster_all.deb
    dpkg -i zabbix-release_5.0-1+buster_all.deb
  2. Then issue the following command to install Zabbix Agent 2:

    For RHEL-based systems:

    dnf install zabbix-agent2

    For Debian-based systems:

    apt install zabbix-agent2

Congratulations, Zabbix agent 2 is now installed and ready to use.

Using a Zabbix agent in Passive mode

Let's start by building a Zabbix agent with passive checks:

  1. After installing Zabbix agent 2, let's open the Zabbix agent configuration file for editing:
    vim /etc/zabbix/zabbix_agent2.conf

    In this file, we edit all the Zabbix agent configuration values we could need from the server side.

  2. Let's start by editing the following values:
    Server=127.0.0.1
    Hostname=Zabbix server
  3. Change Server to the IP of the Zabbix server that will monitor this passive agent. Change Hostname to the hostname of the monitored server.
  4. Now restart the Zabbix agent 2 process:
    systemctl restart zabbix-agent2.service
  5. Now move to the frontend of your Zabbix server and add this host for monitoring.
  6. Go to Configuration | Hosts in your Zabbix frontend and click Create host in the top-right corner.
  7. To create this host in our Zabbix server, we need to fill in the values seen in the following screenshot:
    Figure 2.1 – The Zabbix host creation page for host lar-book-agent

    Figure 2.1 – The Zabbix host creation page for host lar-book-agent

    It's important to add the following:

    • Host name: To identify this host.
    • Groups: To logically group hosts.
    • Interfaces: To monitor this host on a specific interface. No interface means no communication.
  8. It is also important to add a template to this host. As this is a Linux server monitored by a Zabbix agent, let's add the correct out-of-the-box template as shown in the following screenshot:
    Figure 2.2 – The Zabbix host template page for host lar-book-agent

    Figure 2.2 – The Zabbix host template page for host lar-book-agent

  9. Click the Add button and you're done creating this agent host. Now that you've got this host, make sure the ZBX icon turns green, indicating that this host is up and being monitored with the passive Zabbix agent:
    Figure 2.3 – The Zabbix configuration hosts page, host lar-book-agent

    Figure 2.3 – The Zabbix configuration hosts page, host lar-book-agent

  10. You can now see the values received on this host by going to Monitoring | Hosts and checking the Latest data button. Please note that the values could take a while to show up:
Figure 2.4 – The Zabbix latest data page for host lar-book-agent

Figure 2.4 – The Zabbix latest data page for host lar-book-agent

Using a Zabbix agent in Active mode

Now let's check out how to configure the Zabbix agent with active checks. We need to change some values on the monitored Linux server host side:

  1. Start by executing the following command:
    vim /etc/zabbix/zabbix_agent2.conf
  2. Now let's edit the following value to change this host to an active agent:
    ServerActive=127.0.0.1
  3. Change ServerActive to the IP of the Zabbix server that will monitor this passive agent and also change Hostname to lar-book-agent:
    Hostname=lar-book-agent
  4. Now restart the Zabbix agent 2 process:
    systemctl restart zabbix-agent2.service
  5. Now move to the frontend of your Zabbix server and let's add another host with a template to do active checks instead of passive ones.
  6. First, let's rename our passive host. To do that, go to Configuration | Hosts in your Zabbix frontend and click the host we just created. Change Host name as follows:
    Figure 2.5 – The Zabbix host configuration page for host lar-book-agent_passive

    Figure 2.5 – The Zabbix host configuration page for host lar-book-agent_passive

    We are doing this because for an active Zabbix agent, the hostname in the file needs to match our Zabbix server.

  7. Go to Configuration | Hosts in your Zabbix frontend and click Create host in the top-right corner.
  8. Now let's create the host as follows:
    Figure 2.6 – The Zabbix host configuration page for host lar-book-agent

    Figure 2.6 – The Zabbix host configuration page for host lar-book-agent

  9. Also, make sure to add the correct template, named Template OS Linux by Zabbix agent active:
Figure 2.7 – The Zabbix host template page for host lar-book-agent

Figure 2.7 – The Zabbix host template page for host lar-book-agent

Please note that the ZBX icon won't turn green for an active agent. But when we navigate to Monitoring | Hosts and check Latest data, we can see our active data coming in.

Tip

As you might have noticed just now, a Zabbix agent can run in both passive and active mode. Keep this in mind when creating your Zabbix agent templates, as you might want to combine the check types.

How it works…

Now that we have configured our Zabbix agents and know how they should be set up, let's see how the different modes work.

Passive agent

The passive agent works by collecting data from our host with the Zabbix agent. Every time an item on our host reaches its interval, the Zabbix server asks the Zabbix agent what the value is now:

Figure 2.8 – Communication diagram between server and passive agent

Figure 2.8 – Communication diagram between server and passive agent

Active agent

The active agent works by sending data from the Zabbix agent to Zabbix server. Every time an item on our agent reaches its update interval, the agent will send the value to our server. We can also use this to send a notification to our server faster when something goes wrong:

Figure 2.9 – Communication diagram between server and active agent

Figure 2.9 – Communication diagram between server and active agent

As mentioned, we can use both types of checks at the same time, giving us the freedom to configure every type of check we could possibly need. Our setup would then look like this:

Figure 2.10 – Communication diagram between server and both agent types

Figure 2.10 – Communication diagram between server and both agent types

See also

There's a lot of new stuff going on under the hood of Zabbix agent 2; if you're interested in learning more about the core of Zabbix agent 2, check out this cool blog post by Alexey Petrov: https://blog.zabbix.com/magic-of-new-zabbix-agent/8460/.

Working with SNMP monitoring

Now let's do something I enjoy most when working with Zabbix: build SNMP monitoring. My professional roots lie in network engineering, and I have worked a lot with SNMP monitoring to monitor all these different network devices.

Getting ready

To get started, we need the two Linux hosts we used before in the previous recipes:

  • Our Zabbix server host
  • The host we used in the previous recipe to monitor via the Zabbix active agent

How to do it…

Monitoring via SNMP polling is easy and very powerful. We will start by configuring SNMPv3 on our monitored Linux host:

  1. Let's start by issuing the following commands to install SNMP on our host:

    For RHEL-based systems:

    dnf install net-snmp net-snmp-utils

    For Debian-based systems:

    apt-get install net-snmp net-snmp-utils
  2. Now let's create the new SNMPv3 user we will use to monitor our host. Please note that we'll be using insecure passwords, but make sure to use secure passwords for your production environments. Issue the following command:
    net-snmp-create-v3-user -ro -A my_authpass -X my_privpass -a SHA -x AES snmpv3user

    This will create an SNMPv3 user with the username snmpv3user, the authentication password my_authpass, and the privilege password my_privpass.

  3. Now restart the snmpd daemon and enable it at boot:
    systemctl restart snmpd.service
    systemctl enable snmpd.service

    This is all we need to do on the Linux host side; we can now go to the Zabbix frontend to configure our host. Go to Configuration | Hosts in your Zabbix frontend and click Create host in the top-right corner.

  4. Now fill in the host configuration page:
    Figure 2.11 – Zabbix host configuration page for host lar-book-agent_snmp

    Figure 2.11 – Zabbix host configuration page for host lar-book-agent_snmp

  5. Make sure to add the right out-of-the-box template as shown in the following screenshot:
    Figure 2.12 – Zabbix host template page for host lar-book-agent_snmp

    Figure 2.12 – Template OS Linux SNMP

    Tip

    While upgrading from an earlier Zabbix version to Zabbix 5, you won't get all the new out-of-the-box templates. If you feel like you are missing some templates, you can download them at the Zabbix Git repository: https://git.zabbix.com/projects/ZBX/repos/zabbix/browse/templates.

  6. We are using some macros in our configuration here for the username and password. We can use these macros to actually add a bunch of hosts with the same credentials. This is very useful, for instance, if you have a bunch of switches with the same SNMPv3 credentials.

    Let's fill in the macros under Administration | General and use the dropdown to select Macros. Fill in the macros like this:

    Figure 2.13 – Zabbix global macro page with SNMP macros

    Figure 2.13 – Zabbix global macro page with SNMP macros

    A cool new feature in Zabbix 5 is the ability to hide macros in the frontend; do keep in mind that these values are still unencrypted in the Zabbix database.

  7. Use the dropdown to change {$SNMPV3_AUTH} and {$SNMPv3_PRIV} to Secret text:
    Figure 2.14 – Zabbix secure text dropdown for SNMP auth and priv macros

    Figure 2.14 – Zabbix secure text dropdown for SNMP auth and priv macros

  8. Now after applying these changes, we should be able to monitor our Linux server via SNMPv3. Let's go to Monitoring | Hosts and check the Latest data page for our new host:
Figure 2.15 – SNMP latest data for host lar-book-agent_snmp

Figure 2.15 – SNMP latest data for host lar-book-agent_snmp

How it works…

When we create a host as we did in step 4, Zabbix polls the host using SNMP. Polling SNMP like this works with SNMP OIDs. For instance, when we poll the item called Free memory, we ask the SNMP agent running on our Linux host to show us the value for 1.3.6.1.4.1.2021.4.6.0. That value is then returned to us on the Zabbix server:

Figure 2.16 – Diagram showing communication between Zabbix server and SNMP host

Figure 2.16 – Diagram showing communication between Zabbix server and SNMP host

Of course, SNMPv3 adds authentication and encryption to this process.

SNMP OIDs work in a tree structure, meaning every number behind the dot can contain another value. For example, see this for our host:

1.3.6.1.4.1.2021.4 = UCD-SNMP-MIB::memory 

If we poll that Define acronym, we get several OIDs back:

.1.3.6.1.4.1.2021.4.1.0 = INTEGER: 0
.1.3.6.1.4.1.2021.4.2.0 = STRING: swap
.1.3.6.1.4.1.2021.4.3.0 = INTEGER: 1679356 kB
.1.3.6.1.4.1.2021.4.4.0 = INTEGER: 1674464 kB
.1.3.6.1.4.1.2021.4.5.0 = INTEGER: 1872872 kB
.1.3.6.1.4.1.2021.4.6.0 = INTEGER: 184068 kB

That includes our 1.3.6.1.4.1.2021.4.6.0 OID with the value that contains our free memory. This is how SNMP is built, like a tree.

Creating Zabbix simple checks and the Zabbix trapper

In this recipe, we will go over two checks that can help you built some more customized setups. The Zabbix simple checks provide you with an easy way to monitor some specific data. The Zabbix trapper combines with Zabbix sender to get data from your hosts into the server, allowing for some scripting options. Let's get started.

Getting ready

To create these checks, we will need a Zabbix server and a Linux host to monitor. We can use the host with a Zabbix agent and SNMP monitoring from the previous recipes.

Do note for these checks that we do not actually need the Zabbix agent.

How to do it…

Working with simple checks is quite simple, as the name suggests, so let's start.

Creating simple checks

We will create a simple check to monitor whether a service is running and accepting TCP connections on a certain port:

  1. To get this done, we will need to create a new host in Zabbix frontend. Go to Configuration | Hosts in your Zabbix frontend and click Create host in the top-right corner.
  2. Create a host with the following settings:
    Figure 2.17 – Zabbix host configuration page for host lar-book-agent_simple

    Figure 2.17 – Zabbix host configuration page for host lar-book-agent_simple

  3. Now go to Configuration | Hosts, click the newly created host, and go to Items. We want to create a new item here by clicking the Create item button.

    We will create a new item with the following values, and after doing, so we will click the Add button at the bottom of the page:

    Figure 2.18 – Zabbix item port 22 check configuration page for host lar-book-agent_simple

    Figure 2.18 – Zabbix item port 22 check configuration page for host lar-book-agent_simple

    Important note

    We are adding the item key net.tcp.services[SSH,22] here. The port in this case is optional, as we can specify the service SSH with a different port if we would want to.

  4. Now we should be able to see whether our server is accepting SSH connections on port 22 on our Latest data screen. Navigate to Monitoring | Hosts and check the Latest data screen for our new value:
Figure 2.19 – Zabbix Latest data page for host lar-book-agent_simple, item port 22 check

Figure 2.19 – Zabbix Latest data page for host lar-book-agent_simple, item port 22 check

That's all there is to creating your simple checks in Zabbix. Now let's move on to the Zabbix trapper item.

Creating a trapper

We can do some cool stuff with Zabbix trapper items once we get more advanced setups. But for now, let's create an item on our lar-book-agent_simple host:

  1. Go to Configuration | Hosts and click the host, then go to Items. We want to create a new item here again by clicking the Create item button.

    Now let's create the following item and click the Add button:

    Figure 2.20 – Zabbix item trap receiver configuration screen for host lar-book-agent_simple

    Figure 2.20 – Zabbix item trap receiver configuration screen for host lar-book-agent_simple

  2. If we go to the CLI of our monitored server, we can now execute the following to install Zabbix sender:
    dnf install zabbix-sender
  3. After installation, we can use Zabbix sender to send some information to our server:
    zabbix_sender -z 10.16.16.152 -p 10051 -s "lar-book-agent_simple" -k trap -o "Let's test this book trapper"

    Now we should be able to see whether our monitored host has sent out the Zabbix trap and the Zabbix server has received this trap for processing.

  4. Navigate to Monitoring | Hosts and check the Latest data screen for our new value:
Figure 2.21 – Zabbix Latest data page for host lar-book-agent_simple, item trap receiver

Figure 2.21 – Zabbix Latest data page for host lar-book-agent_simple, item trap receiver

There it is, our Zabbix trap in our Zabbix frontend.

How it works…

Now that we have built our new items, let's see how they work by diving into the theoretical side of Zabbix simple checks and trappers.

Simple checks

Zabbix simple checks are basically a list of built-in checks made for monitoring certain values. There is a list and description available on the Zabbix documentation wiki: https://www.zabbix.com/documentation/current/manual/config/items/itemtypes/simple_checks.

All of these checks are performed by the Zabbix server to collect data from a monitored host. For example, when we do the Zabbix simple check to check whether a port is open, our Zabbix server requests simply checks whether it can reach that port.

This means that if your monitored host's firewall is blocking port 22 from Zabbix server, we'll get a service is down value. However, this does not mean that SSH isn't running on the server itself:

Figure 2.22 – Zabbix server-to-host communication diagram

Figure 2.22 – Zabbix server-to-host communication diagram

Tip

Keep in mind that working with simple checks is dependent on external factors such as the firewall settings on the monitored host. When you build a custom simple check, make sure to check these factors as well.

Trappers

When working with Zabbix sender, we are doing exactly the opposite of most checks. We are building an item on our Zabbix server, which allows us to capture trap items. This allows us to build some custom checks to send data to our Zabbix server from a monitored host:

Figure 2.23 – Zabbix server trap receiver diagram

Figure 2.23 – Zabbix server trap receiver diagram

Let's say, for instance, that you want to build a custom Python script that, at the end of running the scripts, sends output to Zabbix server. We could ask Python to send this data with Zabbix sender, and suddenly you'd have this data available for processing on the Zabbix server.

We can really extend our options with Zabbix trapper and customize our Zabbix server even further.

Working with calculated and dependent items

Calculated and dependent items are used in Zabbix to produce additional values from existing values. Sometimes, we have already collected a value and we need to do more with the values created by that item. We can do exactly that by using calculated and dependent items.

Getting ready

To work with calculated items and dependent items, we are going to need the Zabbix server and monitored hosts from the previous recipes. We will add the items on the lar-book-agent_passive host and our Zabbix server host, so we already have some items available to calculate and make dependent.

How to do it…

Let's see how we can extend our items by getting started with the calculated items.

Working with calculated items

  1. Let's navigate to our host configuration by going to Configuration | Hosts and clicking on our lar-book-agent_passive host's items. In the filter field named Name, enter memory and you will get the following output:
    Figure 2.24 – Zabbix item page for host lar-book-agent_passive

    Figure 2.24 – Zabbix item page for host lar-book-agent_passive

  2. What we are going to do now is create a calculated item that is going to show us the average memory utilization over a period of 15 minutes. We can use this value to determine how busy our host was during that period, without having to look at the graphs.
  3. Let's click the Create item button and start creating our new calculated item.

    We want our item to have the following values:

    Figure 2.25 – Zabbix item configuration page, average memory used

    Figure 2.25 – Zabbix item configuration page, average memory used

  4. Now if we go to check our Monitoring | Hosts page and select Latest data, we can check out our value. Make sure to filter in the Name field for memory, so we see the correct values:
Figure 2.26 – Zabbix Latest data page for host lar-book-agent_passive, memory items

Figure 2.26 – Zabbix Latest data page for host lar-book-agent_passive, memory items

Now we can clearly see that we are calculating the 15-minute average of the memory utilization on our newly created item.

Working with dependent items

Time to make our first dependent item. I'll use the lar-book-agent_centos host or our (as it's called by default) Zabbix server. Let's say we want to request some variables from our MySQL database in one big batch. We can then create dependent items on top of the first item to further process the data:

  1. Let's start by creating the main check. Navigate to Configuration | Hosts, select our host, and then let's click the Create item button to start creating our first new item. We want an item with the following variables:
    Figure 2.27 – Zabbix item configuration page, database status

    Figure 2.27 – Zabbix item configuration page, database status

    Now, this item is an SSH check that logs in to our Zabbix server machine and executes the code in the script. The code will then log in to our MariaDB database and it will show the status. Make sure to enter your credentials correctly.

    Tip

    SSH checks can be used for a variety of cool scenarios, such as this one. We simply log in to our CLI and execute a piece of code. Perfect for your custom setups.

  2. Go to Monitoring | Hosts and check out the Latest data page for our new check. There should be a long list of MariaDB values. If so, we can continue with our next step of creating the dependent item.
  3. To create the dependent item, navigate to Configuration | Hosts, select our host, and let's click the Create item button. We want this item to get the following variables:
    Figure 2.28 – Zabbix item configuration page, MariaDB aborted clients

    Figure 2.28 – Zabbix item configuration page, MariaDB aborted clients

  4. It's very important to add preprocessing to this item as well, otherwise we will simply get the same data as our master item. So, let's add the following:
Figure 2.29 – Zabbix item preprocessing page, MariaDB aborted clients

Figure 2.29 – Zabbix item preprocessing page, MariaDB aborted clients

The result will be the number of aborted clients for our MariaDB:

Figure 2.30 – Zabbix Latest data page, MariaDB aborted clients

Figure 2.30 – Zabbix Latest data page, MariaDB aborted clients

How it works…

The types we've discussed in this How to do it… section can be quite complicated; let's go over how the items actually work.

Calculated items

Working with calculated items can be a great way to get even more statistics out of your existing data. Sometimes you just need to combine multiple items into one specific value.

What we did just now works by taking several values in a period of 15 minutes of 1 item and calculating the average like this:

Figure 2.31 – Zabbix dependent item diagram

Figure 2.31 – Zabbix dependent item diagram

We're taking those values and calculating the average every 15 minutes. It gives us a nice indication of what we are doing over a set period of time.

Dependent items

Dependent items work simply by taking the data from a master item and processing that data into other data. This way, we can structure our data and keep our check interval for all these items the same:

Figure 2.32 – Dependent item diagram

Figure 2.32 – Dependent item diagram

As seen here, dependent items basically work as duplicators, with additional preprocessing options. Do note that preprocessing must be used to extract data from the master item. Without preprocessing, our data will be exactly the same as the master item.

Tip

Sometimes we do not require our master item to be saved in our database; we already have the information in our dependent items. When we don't want the master item to be saved, we simply select the Do not keep history option.

Creating external checks

To further extend Zabbix functionality, we can use our own custom scripts, which are used by Zabbix external checks. Not everything that you want to monitor will always be standard in Zabbix, though a lot is. There's always something that could be missing, and external checks are just the way to bypass some of these.

Getting ready

For this recipe, we are going to need just our Zabbix server. We can create an item on our lar-book-centos host, which is our Zabbix server monitored host.

How to do it…

  1. First let's create a script that we will execute in /usr/lib/zabbix/externalscripts/ called test_external with the following command:
    vim /usr/lib/zabbix/externalscripts/test_external

    Add the following code to this file and save:

    #!/bin/bash
    echo $1

    Tip

    Make sure Zabbix server can execute the script by adding the right permissions to the file. The zabbix user on your Linux server needs to be able to access and execute the file.

  2. Let's navigate to our host to create a new item. Navigate to Configuration | Hosts, select our host, lar-book-centos, and click the Create item button. We want this item to get the following variables:
    Figure 2.33 – Zabbix item configuration page

    Figure 2.33 – Zabbix item configuration page

  3. After adding this new item, let's navigate to Monitoring | Hosts and check the Latest data page for our host. We should get our Test variable returned by our script as Value in Zabbix, as shown in the following screenshot:
Figure 2.34 – Zabbix Latest data page

Figure 2.34 – Zabbix Latest data page

Tip

Use the macros in the frontend as variables to send data from your frontend to your scripts. You can further automate your checks with this to enhance your external checks.

How it works…

External checks seem like they have a steep learning curve, but they are actually quite simple from the Zabbix side. All we do is send a command to an external script and expect a result output:

Figure 2.35 – Zabbix server external script communication diagram

Figure 2.35 – Zabbix server external script communication diagram

Like in our example, we sent the value Test to our script, which the script then in turn echoed back to use as $1.

When you have good knowledge of a programming language such as Python, for example, we can use this function to build a lot more expansion to our Zabbix capabilities. A simple yet powerful tool to work with.

Setting up JMX monitoring

Built into Zabbix is JMX monitoring, so we can monitor our Java applications. In this recipe, we'll check out how to monitor Apache Tomcat with Zabbix JMX so we can get a feel for what this monitoring option is all about.

Getting ready

To get ready for this recipe, we are going to need our Zabbix server to monitor our JMX application.

I also used a CentOS 7 machine for this recipe, with Tomcat installed. It can be quite tricky to use Tomcat on CentOS 8 due to package dependencies, so I recommend sticking with 7 for now. You can add the following to your Tomcat configuration after installation to get it working in our recipe:

JAVA_OPTS="-Djava.rmi.server.hostname=10.16.16.155 -Dcom.sun.management.jmxremote -Dcom.sun.management.jmxremote.port=12345 -Dcom.sun.management.jmxremote.authenticate=false -Dcom.sun.management.jmxremote.ssl=false"

How to do it…

To set up JMX monitoring, we are going to add a host to our Zabbix server that will monitor our Apache Tomcat installation. But first, we will need to add some settings to our /etc/zabbix/zabbix_server.conf file:

  1. Let's edit the zabbix_server.conf file by logging in to our Zabbix server and executing the following command:
    Vim /etc/zabbix/zabbix_server.conf
  2. We will then need to add the following lines to this file:
    JavaGateway=127.0.0.1
    StartJavaPollers=5
  3. We will also need to install the zabbix-java-gateway application on our Zabbix server with the following command:
    dnf install zabbix-java-gateway 
    systemctl start zabbix-java-gateway
    systemctl restart zabbix-server

    That is all we need to do on the server side of things to get JMX monitoring to work. Zabbix doesn't include these settings by default, so this is why we need to add the text to our file and install the application.

  4. To get started with monitoring our JMX host, go to Configuration | Hosts in your Zabbix frontend and click Create host in the top-right corner.

    We will then add a host with the following settings:

    Figure 2.36 – Zabbix item configuration page

    Figure 2.36 – Zabbix item configuration page

  5. Let's also make sure to add the following template to our host so we can actually start monitoring the JMX host:
    Figure 2.37 – Zabbix host template page

    Figure 2.37 – Zabbix host template page

  6. After this, our JMX icon should turn green; let's check this under Monitoring | Hosts. It should look like this:
    Figure 2.38 – Zabbix hosts page

    Figure 2.38 – Zabbix hosts page

  7. If we click on the Latest data for our new JMX monitored host, we should also see our incoming data. Check it out; it should return stats like these:
Figure 2.39 – Zabbix Latest data

Figure 2.39 – Zabbix Latest data

How it works…

Zabbix utilizes a Java gateway either hosted on Zabbix server itself or hosted on another server (proxy) to monitor JMX applications:

Figure 2.40 – Communication diagram between Zabbix server and Java

Figure 2.40 – Communication diagram between Zabbix server and Java

Zabbix polls the Java gateway and the Java gateway in turn communicates with our JMX application, as it does with Tomcat in our example. The data in turn is then returned through the same path and we can see our data in our Zabbix server.

See also

There are loads of applications that can be monitored through Zabbix JMX. Check out the Zabbix monitoring and integrations page for more uses of Zabbix JMX monitoring: https://www.zabbix.com/integrations/jmx.

Setting up database monitoring

Databases are a black hole to a lot of engineers; there's data being written to them and there's something being done with this data. But what if you want to know more about the health of your database? That's where Zabbix database monitoring comes in – we can use it to monitor the health of our database to a greater extent.

Getting ready

We'll be monitoring our Zabbix database, for convenience. This means that all we are going to need is our installed Zabbix server with our database on it. We'll be using MariaDB in this example, so if you have a PostgreSQL setup, make sure to install a MariaDB instance on a Linux host.

How to do it…

Before getting started with the item configuration, we'll have to do some stuff on the CLI side of the server:

  1. Let's start by installing the required modules to our server:
    dnf install unixODBC mariadb-connector-odbc
  2. Now let's verify whether our ODBC configuration files exist:
    odbcinst -j

    Your output should look as follows:

    unixODBC 2.3.7
    DRIVERS............: /etc/odbcinst.ini
    SYSTEM DATA SOURCES: /etc/odbc.ini
    FILE DATA SOURCES..: /etc/ODBCDataSources
    USER DATA SOURCES..: /root/.odbc.ini
    SQLULEN Size.......: 8
    SQLLEN Size........: 8
    SQLSETPOSIROW Size.: 8
  3. If the output is correct, we can go to the Linux CLI and continue by editing odbc.ini to connect to our database:
    vim /etc/odbc.ini

    Now fill in your Zabbix database information. It will look like this:

    [book]
    Description = MySQL book test database
    Driver      = mariadb
    Server      = 127.0.0.1
    User        = zabbix
    Password    = password
    Port        = 3306
    Database    = zabbix
  4. Now let's test whether our connection is working as expected by executing this:
    isql book

    You should get a message saying Connected; if you don't, then check your configuration files and try again.

  5. Now let's move to the Zabbix frontend to configure our first database check. Navigate to Configuration | Hosts and click the host called lar-book-centos, or it might still be called Zabbix server. Now go to Items; we want to create a new item here by clicking the Create item button.

    Tip

    If you haven't already, a great way to keep your Zabbix structured is to keep all hostnames in Zabbix equal to the real server hostname. Rename your default Zabbix server host in the frontend to what you've actually called your server.

    We want to add an item with the following parameters:

    Figure 2.41 – Zabbix item configuration page, items in Zabbix database

    Figure 2.41 – Zabbix item configuration page, items in Zabbix database

  6. Now if you go to Monitoring | Hosts and click the Latest data for our host, you'll get to see this:
Figure 2.42 – Zabbix Latest data page for host lar-book-centos, items in Zabbix database

Figure 2.42 – Zabbix Latest data page for host lar-book-centos, items in Zabbix database

We can now see directly from the database how many items are written to it.

How it works…

The Zabbix database monitoring works by connecting to your database with the ODBC middleware API. Any database supported by ODBC can be queried with Zabbix database monitoring:

Figure 2.43 – Diagram showing Zabbix server ODBC communication

Figure 2.43 – Diagram showing Zabbix server ODBC communication

Basically, your Zabbix server sends a command with, for instance, your MySQL query to the ODBC connector. Your ODBC connecter sends this query to the database, which in turn returns a value to ODBC. ODBC then forwards the value to Zabbix server and hey presto: we have a value under our item.

There's more…

You can do loads of queries to your databases with Zabbix database monitoring, but keep in mind that you are working with actual queries. Querying a database takes time and processing power, so keep your database monitoring structured and define the right execution times.

Setting up HTTP agent monitoring

With the Zabbix HTTP agent, we can monitor a web page or API by retrieving data from it. For instance, if there's a counter on a web page and we want to keep an eye on that counter value, we can do so with Zabbix HTTP monitor.

Getting ready

We are going to need a web page to monitor and we will need our Zabbix server. For your convenience, we've added a page to our own website to retrieve a value from. Here's the page: https://oicts.com/book-page/.

Please also note that your Zabbix server will need an active internet connection for this recipe.

How to do it…

Let's poll this special web page we've created for you for the visitor count that's currently configured on it. This is a real counter for the number of times (unique) visitors have opened the URL:

  1. Navigate to your Zabbix frontend and navigate to Configuration | Hosts, then click the host called lar-book-agent_simple. Now go to Items; we want to create a new item here by clicking the Create item button. Now we are going to need to create an HTTP agent item as shown in the following screenshot:
    Figure 2.44 – Zabbix Item configuration page, visitor count on oicts.com page

    Figure 2.44 – Zabbix Item configuration page, visitor count on oicts.com page

    Use the following preprocessing steps:

    Figure 2.45 – Zabbix Item preprocessing page

    Figure 2.45 – Zabbix Item preprocessing page

  2. Now navigate to Monitoring | Hosts and open the Latest data page for our lar-book-agent_simple host. If everything is working as it should, we should now be requesting this page's visitor count every 15 minutes as follows:
Figure 2.46 – Zabbix Latest data page

Figure 2.46 – Zabbix Latest data page

How it works…

What we do here is request the complete web page from Zabbix by navigating to the page with the HTTP agent and downloading it. When we have the complete content of the page, in this case, an HTML/PHP page, we can process the data:

Figure 2.47 – Diagram showing Zabbix HTTP agent communication

Figure 2.47 – Diagram showing Zabbix HTTP agent communication

We ask our preprocessor via a regex to go through the requested code and only show the number behind where it says Total Page Visits:.

All that's left is the number, ready for us to use in graphs and other types of data visualization.

Using Zabbix preprocessing to alter item values

Preprocessing item values is an important functionality in Zabbix; we can use it to create all kinds of checks. We've already done some preprocessing in this chapter, but let's take a deeper dive into it and what it does.

Getting started

We are going to need a Zabbix server to create our check for. We will also need a passive Zabbix agent on a Linux host to get our values from and preprocess them. We can use the agent that is running on our Zabbix server for this; in my case, this is lar-book-centos.

How to do it…

  1. Let's start by logging in to our Zabbix frontend and going to Configuration | Hosts.
  2. Click on your Zabbix server host; in my case, it's called lar-book-centos.
  3. Now go to Items and click on the blue Create item button in the top-right corner. Let's create a new item with the following information:
    Figure 2.48 – New item creation screen, Get traffic statistics from CLI

    Figure 2.48 – New item creation screen, Get traffic statistics from CLI

  4. Make sure to change ens192 to your own primary network interface. You can find your primary network interface by logging in to the Linux CLI and executing the following:
    ifconfig
  5. Back at the create item screen, click on the blue Add button. This item will use the Zabbix agent to execute a remote command on the Linux CLI.
  6. When we navigate to this new item, we can see that the item becomes unsupported. This is because when we use the system.run key, we need to allow it in the Zabbix agent configuration:
    Figure 2.49 – Unsupported item information, Unknow metric system.run

    Figure 2.49 – Unsupported item information, Unknow metric system.run

  7. Log in to the Linux CLI of the monitored host and edit the Zabbix agent configuration with this:
    vim /etc/zabbix/zabbix_agent2.conf
  8. Go to the Option: AllowKey line and add AllowKey=system.run[*] as here:
    Figure 2.50 – Zabbix agent configuration file, AllowKey system.run

    Figure 2.50 – Zabbix agent configuration file, AllowKey system.run

  9. Save the file and restart the Zabbix agent with this:
    systemctl restart zabbix-agent2
  10. Back at the Zabbix frontend, the error we noticed in step 6 should be gone after a few minutes.
  11. Navigate to Monitoring | Latest data and filter on your Zabbix server host lar-book-centos and the name of the new Get traffic statistics from CLI item.
  12. The value should now be pulled from the host. If we click on History, we can see the full value; it should look as follows:
    Figure 2.51 – Zabbix agent system.run command executing 'ifconfig ens192' results

    Figure 2.51 – Zabbix agent system.run command executing 'ifconfig ens192' results

  13. The information seen in the image is way too much for just one item. We need to split this up. Let's use pre-processing to get the number of RX bytes from the information.
  14. Go back to Configuration | Hosts and click on your Zabbix server host. Go to Items on this host.
  15. Click on the Get traffic statistics from CLI item to edit it. Change the name to Total RX traffic in bytes for ens192 and add B to Units. It will look like this:
    Figure 2.52 – Zabbix agent system.run item

    Figure 2.52 – Zabbix agent system.run item

  16. Now click on Preprocessing and click on the underlined Add button.
  17. A Regular expression (regex) field will be added, which we are going to fill to match the total number of bytes for your interface. Fill in the following:
    Figure 2.53 – Zabbix agent system.run item preprocessing

    Figure 2.53 – Zabbix agent system.run item preprocessing

  18. Make sure to also select the box under Custom on fail.
  19. Let's click on the underlined Add button again and use the drop-down menu for this new step to select Discard unchanged. The end result will look like this:
    Figure 2.54 – Zabbix agent system.run item preprocessing

    Figure 2.54 – Zabbix agent system.run item preprocessing

  20. We can now press the blue Update button to finish editing this item.
  21. Navigate back to Monitoring | Latest data and filter on your host and the new item name, Total RX traffic in bytes for ens192. Make sure to use your own interface name.
  22. We can now see our value coming in, and we have an item displaying our total RX traffic for our main interface:
Figure 2.55 – Zabbix Total RX traffic item latest data

Figure 2.55 – Zabbix Total RX traffic item latest data

How it works…

We've already done some preprocessing in the Working with calculated and dependent items recipe to get data from a master item. We also used preprocessing in the Setting up HTTP agent monitoring recipe to get a specific value from a web page. We didn't go over the preprocessing concepts used in those recipes, though, so let's go over them.

When working with preprocessing, it's important to know the basic setup. Let's take a look at the incoming data before we used preprocessing:

Figure 2.56 – Zabbix agent system.run command executing 'ifconfig ens192' results

Figure 2.56 – Zabbix agent system.run command executing 'ifconfig ens192' results

This is a lot of information. When we look at how Zabbix items are used, we try to put graspable information in a single item. Luckily, we can preprocess this item before we store the value in Zabbix. In the following figure, we can see the preprocessing steps we added to our item:

Figure 2.57 – Zabbix agent system.run item preprocessing with 2 steps

Figure 2.57 – Zabbix agent system.run item preprocessing with 2 steps

Our first step is a regex. This step will make sure to only use the numbers we need. We match on the word RX, then the word bytes and a sequence of numbers after them. This way, we end up with the total number of RX bytes in capture group 2. This is why we fill in \2 in the output field. We also specify Custom on fail, which will discard any value if the regex doesn't match.

Our second step is to discard any values that are the same as the value received before. Instead of storing duplicate values, we simply discard them and save some space in our Zabbix database.

Tip

It's a lot easier to build a regex when using an online tool such as https://regex101.com/. You can see what number your capture groups will get and there's a lot of valuable information in the tools as well.

It's important to note here that steps are executed in the sequence they are defined in the frontend. If the first step fails, the item becomes unsupported unless Custom on fail is set to do something else.

By adding preprocessing to Zabbix, we open up a whole range of options for our items, and we are able to alter our data in almost any way required. These two steps are just the beginning of the options opened up when diving into the world of Zabbix preprocessing.

See also

Preprocessing in Zabbix is an important subject and it's impossible to cover every aspect of it in a single recipe. The two preprocessing steps in this recipe's example are just two of the many options we can use. Check out the official Zabbix documentation to see the other options we can use:

https://www.zabbix.com/documentation/current/manual/config/items/preprocessing

Left arrow icon Right arrow icon
Download code icon Download Code

Key benefits

  • Find out how you can leverage some of the most exciting features of Zabbix 5
  • Perform professional IT infrastructure and application monitoring on multiple platforms
  • Discover easy-to-follow, practical solutions to problems in network monitoring with Zabbix

Description

Zabbix offers useful insights into your infrastructure performance and issues and enables you to enhance your monitoring setup with its variety of powerful features. This book covers hands-on, easy-to-follow recipes for using Zabbix 5 for effectively monitoring the performance of devices and applications over networks. The book starts by guiding you through the installation of Zabbix and using the Zabbix frontend. You'll then work your way through the most prominent features of Zabbix and make the right design choices for building a scalable and easily manageable environment. The book contains recipes for building items and triggers for different types of monitoring, building templates, and using Zabbix proxies. As you advance, you’ll learn how to use the Zabbix API for customization and manage your Zabbix server and database efficiently. Finally, you'll find quick solutions to the common and not-so-common problems that you may encounter in your everyday Zabbix monitoring work. By the end of this Zabbix book, you’ll have learned how to use Zabbix for all your monitoring needs and be able to build a solid Zabbix setup by leveraging its key functionalities.

Who is this book for?

This book is for IT engineers who want to get started with Zabbix and anyone with an intermediate understanding of Zabbix looking to extend their knowledge. Although not necessary, prior experience with Zabbix will help you to make the most of this book.

What you will learn

  • Explore the different types of monitoring available in Zabbix 5
  • Find out how to build your own Zabbix templates
  • Use Zabbix proxies for effective load balancing/scaling
  • Work with custom integrations and the Zabbix API
  • Set up triggers and alerting with Zabbix 5
  • Maintain your Zabbix setup for scaling, backups, and upgrades
  • Discover how to perform advanced Zabbix database management
  • Monitor cloud-based products such as Amazon Web Services (AWS), Azure, and Docker
Estimated delivery fee Deliver to Colombia

Standard delivery 10 - 13 business days

$19.95

Premium delivery 3 - 6 business days

$40.95
(Includes tracking information)

Product Details

Country selected
Publication date, Length, Edition, Language, ISBN-13
Publication date : Feb 26, 2021
Length: 428 pages
Edition : 1st
Language : English
ISBN-13 : 9781800202238
Vendor :
Zabbix
Concepts :
Tools :

What do you get with Print?

Product feature icon Instant access to your digital eBook copy whilst your Print order is Shipped
Product feature icon Paperback book shipped to your preferred address
Product feature icon Download this book in EPUB and PDF formats
Product feature icon Access this title in our online reader with advanced features
Product feature icon DRM FREE - Read whenever, wherever and however you want
Product feature icon AI Assistant (beta) to help accelerate your learning
OR
Modal Close icon
Payment Processing...
tick Completed

Shipping Address

Billing Address

Shipping Methods
Estimated delivery fee Deliver to Colombia

Standard delivery 10 - 13 business days

$19.95

Premium delivery 3 - 6 business days

$40.95
(Includes tracking information)

Product Details

Publication date : Feb 26, 2021
Length: 428 pages
Edition : 1st
Language : English
ISBN-13 : 9781800202238
Vendor :
Zabbix
Concepts :
Tools :

Packt Subscriptions

See our plans and pricing
Modal Close icon
$19.99 billed monthly
Feature tick icon Unlimited access to Packt's library of 7,000+ practical books and videos
Feature tick icon Constantly refreshed with 50+ new titles a month
Feature tick icon Exclusive Early access to books as they're written
Feature tick icon Solve problems while you work with advanced search and reference features
Feature tick icon Offline reading on the mobile app
Feature tick icon Simple pricing, no contract
$199.99 billed annually
Feature tick icon Unlimited access to Packt's library of 7,000+ practical books and videos
Feature tick icon Constantly refreshed with 50+ new titles a month
Feature tick icon Exclusive Early access to books as they're written
Feature tick icon Solve problems while you work with advanced search and reference features
Feature tick icon Offline reading on the mobile app
Feature tick icon Choose a DRM-free eBook or Video every month to keep
Feature tick icon PLUS own as many other DRM-free eBooks or Videos as you like for just $5 each
Feature tick icon Exclusive print discounts
$279.99 billed in 18 months
Feature tick icon Unlimited access to Packt's library of 7,000+ practical books and videos
Feature tick icon Constantly refreshed with 50+ new titles a month
Feature tick icon Exclusive Early access to books as they're written
Feature tick icon Solve problems while you work with advanced search and reference features
Feature tick icon Offline reading on the mobile app
Feature tick icon Choose a DRM-free eBook or Video every month to keep
Feature tick icon PLUS own as many other DRM-free eBooks or Videos as you like for just $5 each
Feature tick icon Exclusive print discounts

Frequently bought together


Stars icon
Total $ 146.97
Zabbix 6 IT Infrastructure Monitoring Cookbook
$53.99
Mastering Linux Administration
$43.99
Zabbix 5 IT Infrastructure Monitoring Cookbook
$48.99
Total $ 146.97 Stars icon
Banner background image

Table of Contents

13 Chapters
Chapter 1: Getting Started with Zabbix and User Management Chevron down icon Chevron up icon
Chapter 2: Setting Up Zabbix Monitoring Chevron down icon Chevron up icon
Chapter 3: Working with Triggers and Alerts Chevron down icon Chevron up icon
Chapter 4: Building Your Own Structured Templates Chevron down icon Chevron up icon
Chapter 5: Visualizing Data, Inventory, and Reporting Chevron down icon Chevron up icon
Chapter 6: Using Discovery for Automatic Creation Chevron down icon Chevron up icon
Chapter 7: Setting Up Zabbix Proxies Chevron down icon Chevron up icon
Chapter 8: Integrating Zabbix with External Services Chevron down icon Chevron up icon
Chapter 9: Extending Zabbix Functionality with Custom Scripts and the Zabbix API Chevron down icon Chevron up icon
Chapter 10: Maintaining Your Zabbix Setup Chevron down icon Chevron up icon
Chapter 11: Advanced Zabbix Database Management Chevron down icon Chevron up icon
Chapter 12: Bringing Zabbix to the Cloud with Zabbix Cloud Integration Chevron down icon Chevron up icon
Other Books You May Enjoy Chevron down icon Chevron up icon

Customer reviews

Rating distribution
Full star icon Full star icon Full star icon Full star icon Full star icon 5
(3 Ratings)
5 star 100%
4 star 0%
3 star 0%
2 star 0%
1 star 0%
Amazon Customer Mar 08, 2021
Full star icon Full star icon Full star icon Full star icon Full star icon 5
Excellent book. Highly recommended for IT infrastructure monitoring. I was in the need for server and network devices monitoring so i tried Zabbix. Learning Zabbix advances features using this book is a great advance for my work.
Amazon Verified review Amazon
Donald A. Tevault Mar 07, 2021
Full star icon Full star icon Full star icon Full star icon Full star icon 5
If you're looking for a network monitoring solution, Zabbix is a great choice. In this book, the authors do a great job of explaining Zabbix, and provide many hands-on procedures that will help get you going. In addition to showing you how to do the normal Zabbix procedures, they also show you how to create your own custom Zabbix extensions. So, if you need to learn Zabbix, you won't go wrong with this book.Full disclosure: I'm also an author for Packt Publishing.
Amazon Verified review Amazon
Lalit Agarwal Mar 11, 2021
Full star icon Full star icon Full star icon Full star icon Full star icon 5
I found book this book a great resource for my network monitoring needs. It has everything I needed. The authors do a fantastic job at explaining Zabbix. It has tons of hands on recipes guide you step by step how to set up your network monitoring. well written and easy to read.
Amazon Verified review Amazon
Get free access to Packt library with over 7500+ books and video courses for 7 days!
Start Free Trial

FAQs

What is the delivery time and cost of print book? Chevron down icon Chevron up icon

Shipping Details

USA:

'

Economy: Delivery to most addresses in the US within 10-15 business days

Premium: Trackable Delivery to most addresses in the US within 3-8 business days

UK:

Economy: Delivery to most addresses in the U.K. within 7-9 business days.
Shipments are not trackable

Premium: Trackable delivery to most addresses in the U.K. within 3-4 business days!
Add one extra business day for deliveries to Northern Ireland and Scottish Highlands and islands

EU:

Premium: Trackable delivery to most EU destinations within 4-9 business days.

Australia:

Economy: Can deliver to P. O. Boxes and private residences.
Trackable service with delivery to addresses in Australia only.
Delivery time ranges from 7-9 business days for VIC and 8-10 business days for Interstate metro
Delivery time is up to 15 business days for remote areas of WA, NT & QLD.

Premium: Delivery to addresses in Australia only
Trackable delivery to most P. O. Boxes and private residences in Australia within 4-5 days based on the distance to a destination following dispatch.

India:

Premium: Delivery to most Indian addresses within 5-6 business days

Rest of the World:

Premium: Countries in the American continent: Trackable delivery to most countries within 4-7 business days

Asia:

Premium: Delivery to most Asian addresses within 5-9 business days

Disclaimer:
All orders received before 5 PM U.K time would start printing from the next business day. So the estimated delivery times start from the next day as well. Orders received after 5 PM U.K time (in our internal systems) on a business day or anytime on the weekend will begin printing the second to next business day. For example, an order placed at 11 AM today will begin printing tomorrow, whereas an order placed at 9 PM tonight will begin printing the day after tomorrow.


Unfortunately, due to several restrictions, we are unable to ship to the following countries:

  1. Afghanistan
  2. American Samoa
  3. Belarus
  4. Brunei Darussalam
  5. Central African Republic
  6. The Democratic Republic of Congo
  7. Eritrea
  8. Guinea-bissau
  9. Iran
  10. Lebanon
  11. Libiya Arab Jamahriya
  12. Somalia
  13. Sudan
  14. Russian Federation
  15. Syrian Arab Republic
  16. Ukraine
  17. Venezuela
What is custom duty/charge? Chevron down icon Chevron up icon

Customs duty are charges levied on goods when they cross international borders. It is a tax that is imposed on imported goods. These duties are charged by special authorities and bodies created by local governments and are meant to protect local industries, economies, and businesses.

Do I have to pay customs charges for the print book order? Chevron down icon Chevron up icon

The orders shipped to the countries that are listed under EU27 will not bear custom charges. They are paid by Packt as part of the order.

List of EU27 countries: www.gov.uk/eu-eea:

A custom duty or localized taxes may be applicable on the shipment and would be charged by the recipient country outside of the EU27 which should be paid by the customer and these duties are not included in the shipping charges been charged on the order.

How do I know my custom duty charges? Chevron down icon Chevron up icon

The amount of duty payable varies greatly depending on the imported goods, the country of origin and several other factors like the total invoice amount or dimensions like weight, and other such criteria applicable in your country.

For example:

  • If you live in Mexico, and the declared value of your ordered items is over $ 50, for you to receive a package, you will have to pay additional import tax of 19% which will be $ 9.50 to the courier service.
  • Whereas if you live in Turkey, and the declared value of your ordered items is over € 22, for you to receive a package, you will have to pay additional import tax of 18% which will be € 3.96 to the courier service.
How can I cancel my order? Chevron down icon Chevron up icon

Cancellation Policy for Published Printed Books:

You can cancel any order within 1 hour of placing the order. Simply contact [email protected] with your order details or payment transaction id. If your order has already started the shipment process, we will do our best to stop it. However, if it is already on the way to you then when you receive it, you can contact us at [email protected] using the returns and refund process.

Please understand that Packt Publishing cannot provide refunds or cancel any order except for the cases described in our Return Policy (i.e. Packt Publishing agrees to replace your printed book because it arrives damaged or material defect in book), Packt Publishing will not accept returns.

What is your returns and refunds policy? Chevron down icon Chevron up icon

Return Policy:

We want you to be happy with your purchase from Packtpub.com. We will not hassle you with returning print books to us. If the print book you receive from us is incorrect, damaged, doesn't work or is unacceptably late, please contact Customer Relations Team on [email protected] with the order number and issue details as explained below:

  1. If you ordered (eBook, Video or Print Book) incorrectly or accidentally, please contact Customer Relations Team on [email protected] within one hour of placing the order and we will replace/refund you the item cost.
  2. Sadly, if your eBook or Video file is faulty or a fault occurs during the eBook or Video being made available to you, i.e. during download then you should contact Customer Relations Team within 14 days of purchase on [email protected] who will be able to resolve this issue for you.
  3. You will have a choice of replacement or refund of the problem items.(damaged, defective or incorrect)
  4. Once Customer Care Team confirms that you will be refunded, you should receive the refund within 10 to 12 working days.
  5. If you are only requesting a refund of one book from a multiple order, then we will refund you the appropriate single item.
  6. Where the items were shipped under a free shipping offer, there will be no shipping costs to refund.

On the off chance your printed book arrives damaged, with book material defect, contact our Customer Relation Team on [email protected] within 14 days of receipt of the book with appropriate evidence of damage and we will work with you to secure a replacement copy, if necessary. Please note that each printed book you order from us is individually made by Packt's professional book-printing partner which is on a print-on-demand basis.

What tax is charged? Chevron down icon Chevron up icon

Currently, no tax is charged on the purchase of any print book (subject to change based on the laws and regulations). A localized VAT fee is charged only to our European and UK customers on eBooks, Video and subscriptions that they buy. GST is charged to Indian customers for eBooks and video purchases.

What payment methods can I use? Chevron down icon Chevron up icon

You can pay with the following card types:

  1. Visa Debit
  2. Visa Credit
  3. MasterCard
  4. PayPal
What is the delivery time and cost of print books? Chevron down icon Chevron up icon

Shipping Details

USA:

'

Economy: Delivery to most addresses in the US within 10-15 business days

Premium: Trackable Delivery to most addresses in the US within 3-8 business days

UK:

Economy: Delivery to most addresses in the U.K. within 7-9 business days.
Shipments are not trackable

Premium: Trackable delivery to most addresses in the U.K. within 3-4 business days!
Add one extra business day for deliveries to Northern Ireland and Scottish Highlands and islands

EU:

Premium: Trackable delivery to most EU destinations within 4-9 business days.

Australia:

Economy: Can deliver to P. O. Boxes and private residences.
Trackable service with delivery to addresses in Australia only.
Delivery time ranges from 7-9 business days for VIC and 8-10 business days for Interstate metro
Delivery time is up to 15 business days for remote areas of WA, NT & QLD.

Premium: Delivery to addresses in Australia only
Trackable delivery to most P. O. Boxes and private residences in Australia within 4-5 days based on the distance to a destination following dispatch.

India:

Premium: Delivery to most Indian addresses within 5-6 business days

Rest of the World:

Premium: Countries in the American continent: Trackable delivery to most countries within 4-7 business days

Asia:

Premium: Delivery to most Asian addresses within 5-9 business days

Disclaimer:
All orders received before 5 PM U.K time would start printing from the next business day. So the estimated delivery times start from the next day as well. Orders received after 5 PM U.K time (in our internal systems) on a business day or anytime on the weekend will begin printing the second to next business day. For example, an order placed at 11 AM today will begin printing tomorrow, whereas an order placed at 9 PM tonight will begin printing the day after tomorrow.


Unfortunately, due to several restrictions, we are unable to ship to the following countries:

  1. Afghanistan
  2. American Samoa
  3. Belarus
  4. Brunei Darussalam
  5. Central African Republic
  6. The Democratic Republic of Congo
  7. Eritrea
  8. Guinea-bissau
  9. Iran
  10. Lebanon
  11. Libiya Arab Jamahriya
  12. Somalia
  13. Sudan
  14. Russian Federation
  15. Syrian Arab Republic
  16. Ukraine
  17. Venezuela