Search icon CANCEL
Subscription
0
Cart icon
Your Cart (0 item)
Close icon
You have no products in your basket yet
Arrow left icon
Explore Products
Best Sellers
New Releases
Books
Videos
Audiobooks
Learning Hub
Free Learning
Arrow right icon
Arrow up icon
GO TO TOP
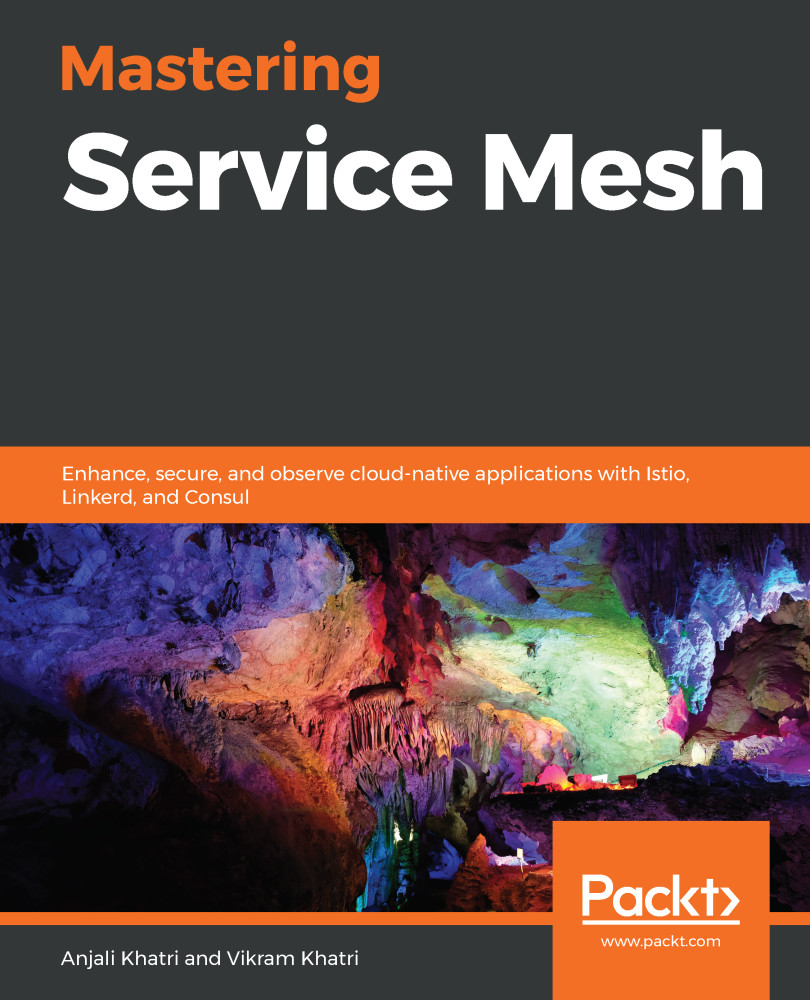
Mastering Service Mesh

You're reading from   Mastering Service Mesh Enhance, secure, and observe cloud-native applications with Istio, Linkerd, and Consul

Arrow left icon
Product type Paperback
Published in Mar 2020
Publisher Packt
ISBN-13 9781789615791
Length 626 pages
Edition 1st Edition
Languages
Tools
Arrow right icon
Authors (2):
Arrow left icon
Vikram Khatri Vikram Khatri
Author Profile Icon Vikram Khatri
Vikram Khatri
Anjali Khatri Anjali Khatri
Author Profile Icon Anjali Khatri
Anjali Khatri
Arrow right icon
View More author details
Toc

Table of Contents (31) Chapters Close

Preface 1. Section 1: Cloud-Native Application Management
2. Monolithic Versus Microservices FREE CHAPTER 3. Cloud-Native Applications 4. Section 2: Architecture
5. Service Mesh Architecture 6. Service Mesh Providers 7. Service Mesh Interface and SPIFFE 8. Section 3: Building a Kubernetes Environment
9. Building Your Own Kubernetes Environment 10. Section 4: Learning about Istio through Examples
11. Understanding the Istio Service Mesh 12. Installing a Demo Application 13. Installing Istio 14. Exploring Istio Traffic Management Capabilities 15. Exploring Istio Security Features 16. Enabling Istio Policy Controls 17. Exploring Istio Telemetry Features 18. Section 5: Learning about Linkerd through Examples
19. Understanding the Linkerd Service Mesh 20. Installing Linkerd 21. Exploring the Reliability Features of Linkerd 22. Exploring the Security Features of Linkerd 23. Exploring the Observability Features of Linkerd 24. Section 6: Learning about Consul through Examples
25. Understanding the Consul Service Mesh 26. Installing Consul 27. Exploring the Service Discovery Features of Consul 28. Exploring Traffic Management in Consul 29. Assessment 30. Other Books You May Enjoy

Summary

As we have seen in this chapter, the Linkerd observability feature is simple and out of the box, which means it doesn't need any special configuration. It presents the key performance indicators for the deployment, pod, and route levels through both the CLI and the dashboard. Its integration with Prometheus through a built-in panel for Grafana is an easy way to drill down from a higher level to a lower level, as shown in the exercises in this chapter.

One of the interesting and useful features of Linkerd is that it can aggregate and show Key Performance Indicators (KPI) such as RPS, P50, P95, P99, and Success Rate (SR). These KPIs can be very helpful to SRE team members when they need to investigate problems.

With this chapter, we have explored the various features of the Linkerd service mesh. In the next chapter, we will go through the third service mesh –...

lock icon The rest of the chapter is locked
Register for a free Packt account to unlock a world of extra content!
A free Packt account unlocks extra newsletters, articles, discounted offers, and much more. Start advancing your knowledge today.
Unlock this book and the full library FREE for 7 days
Get unlimited access to 7000+ expert-authored eBooks and videos courses covering every tech area you can think of
Renews at $19.99/month. Cancel anytime
Banner background image