With this environment, we can debug our components too. It would be very useful to see how our components work inside the WildFly container. To start the debug process, simply enter the sub-project you want to test and enter, for example, the following command:
mvn test -Djboss.options="-Xdebug -Xrunjdwp:transport=dt_socket,address=8001,server=y,suspend=y"
Jboss.options is a property used by the Arquillian container managed subproject to add external properties to the start of WildFly startup process. So you can pass Java properties to set the debug environment.
In our case, we force WildFly to use the following parameters:
- debug: This activates debug mode. If set to false, the next parameters will not be considered.
- runjdwp: transport JDWP is the common communication protocol used to start the debug. The transport can be of type DT_SOCKET used in Linux or DT_SHMEM used in Windows.
Other parameters to add in the transport are:
- Address: The client/server connection URL. It can be valorized as 8001. Adding only the port we presume the transport running on localhost, the same machine we will start the debug. When WildFly starts, after setting these properties, a JDWP server automatically starts on the specified port:
- Server: It must be set to y or else no server can be started:
- Suspend: If set to y, WildFly will wait for one connection by a JDWP client; otherwise it will be waiting. If set to n, WildFly will start anyway, leaving the connections free to start at another time.
Here is the complete command you need to start the debug:
-Xdebug -Xrunjdwp:transport=dt_socket,address=8001,server=y,suspend=n
Once the test starts, thanks to the suspend property. WildFly will be suspended till we start the JPDA client. This client is ready to work in Eclipse. Here's how to configure and start it.
Click on the row near the debug figure and select Debug Configurations...:
On, the item remote Java debugger right-click and select New:
You will see a new window. Fill in the fields like this:
The field port must be the same as the one used in jboss.options so that the client can connect to the JPDA server that was started in the test. The Project field can be one of the subprojects inside our exercises.
Now close the window. We need to put in a breakpoint, so we show the debugger at work. Simply, take a code class of the project you would like to test and click twice on a row, for example:
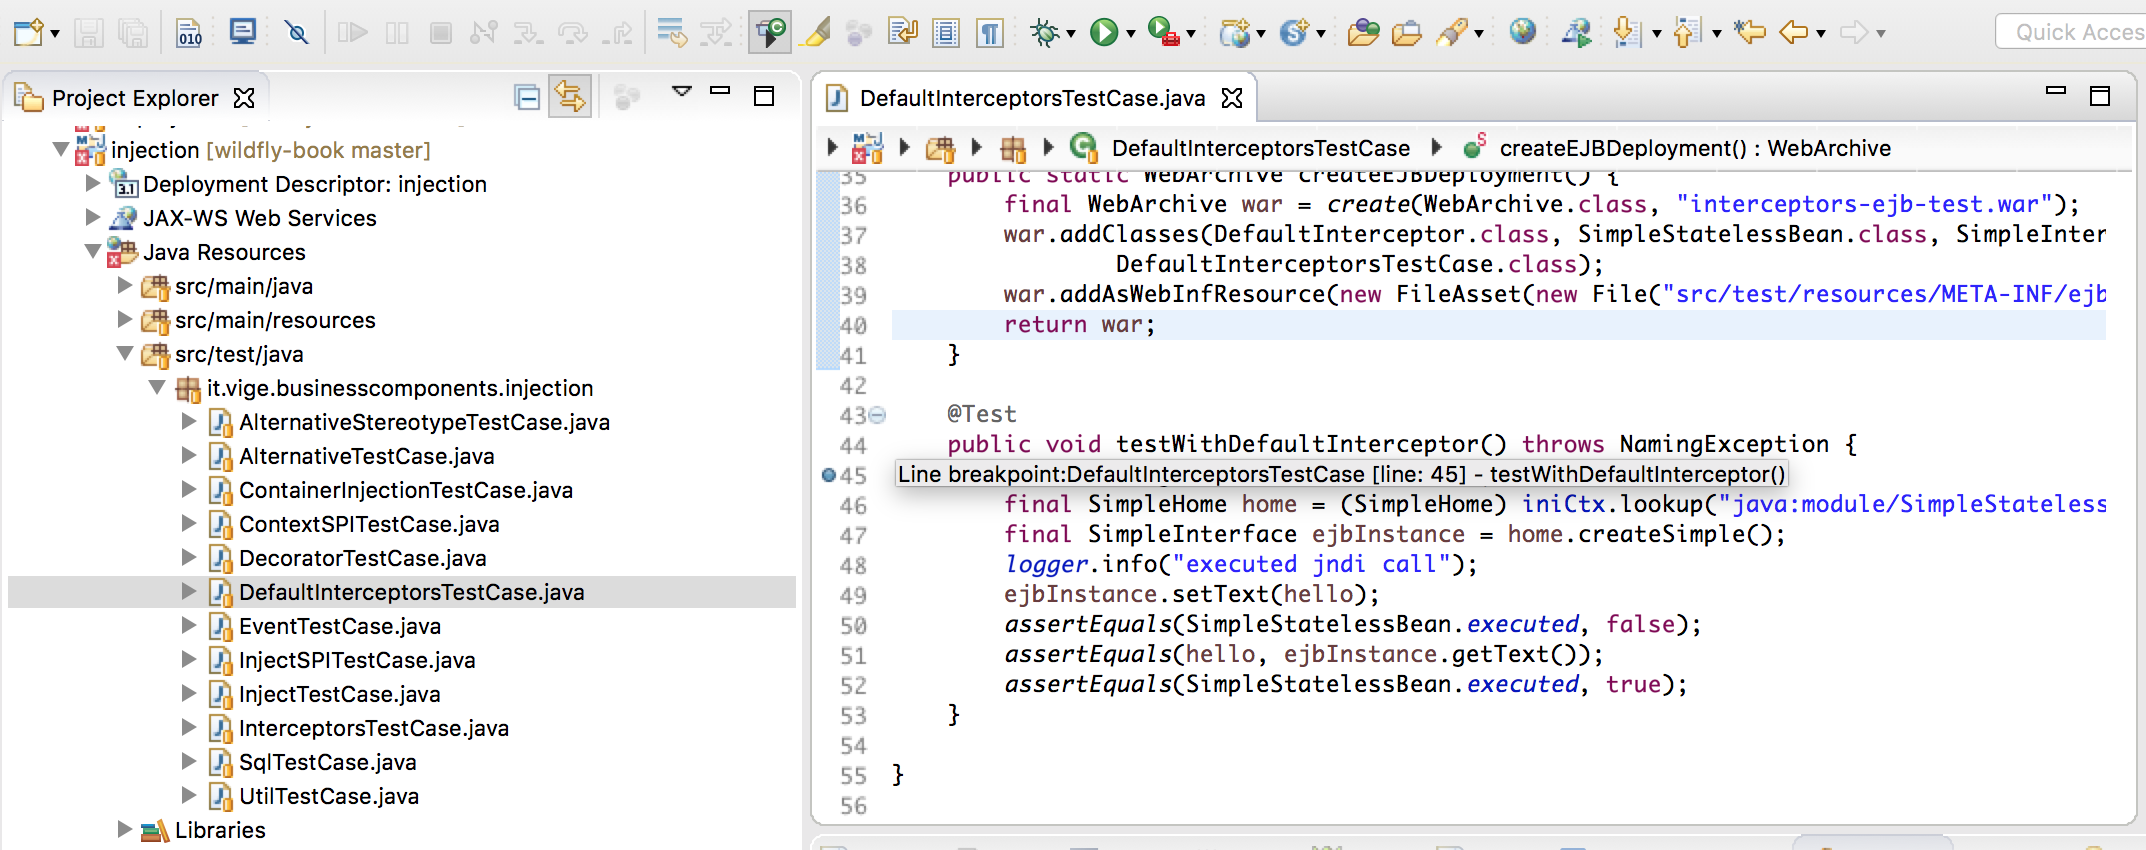
Again launch Debug Configurations and start the debugger:
Your breakpoint is now active!
Now we have all of the environment ready to work. In the next chapter, we will see tests and how to start them depending on the argument.
In other samples, you will find that Arquillian uses an annotation called @RunAsClient that lets you start test cases outside the container as remote clients. In that case, you cannot use jboss.options to start the debug because it starts the debug only inside the container.
To debug remote clients annotated with the @RunAsClient annotation, use this script:
mvn test -Dmaven.surefire.debug
And configure your JPDA client with the default port, 5005.
 United States
 Great Britain
 India
India
 Germany
 France
 Canada
 Russia
 Spain
Spain
 Brazil
 Australia
 Singapore
 Hungary
 Ukraine
 Luxembourg
 Estonia
 Lithuania
 South Korea
 Turkey
 Switzerland
 Colombia
 Taiwan
 Chile
Chile
 Norway
 Ecuador
 Indonesia
 New Zealand
 Cyprus
 Denmark
 Finland
 Poland
 Malta
Malta
 Czechia
 Austria
 Sweden
 Italy
Italy
 Egypt
Egypt
 Belgium
 Portugal
 Slovenia
 Ireland
 Romania
 Greece
 Argentina
 Netherlands
 Bulgaria
 Latvia
 South Africa
 Malaysia
 Japan
Japan
 Slovakia
 Philippines
 Mexico
 Thailand
