OmniDB has the standard tree-view browsing interface, with multi-tab access for each database server you access. It's easy to be connected to multiple PostgreSQL, MySQL, and Oracle database servers at the same time:
OmniDB has a SQL editor that has code completion and debugging. The EXPLAIN ANALYZE output is colored to highlight the areas of the plan that take the most time:
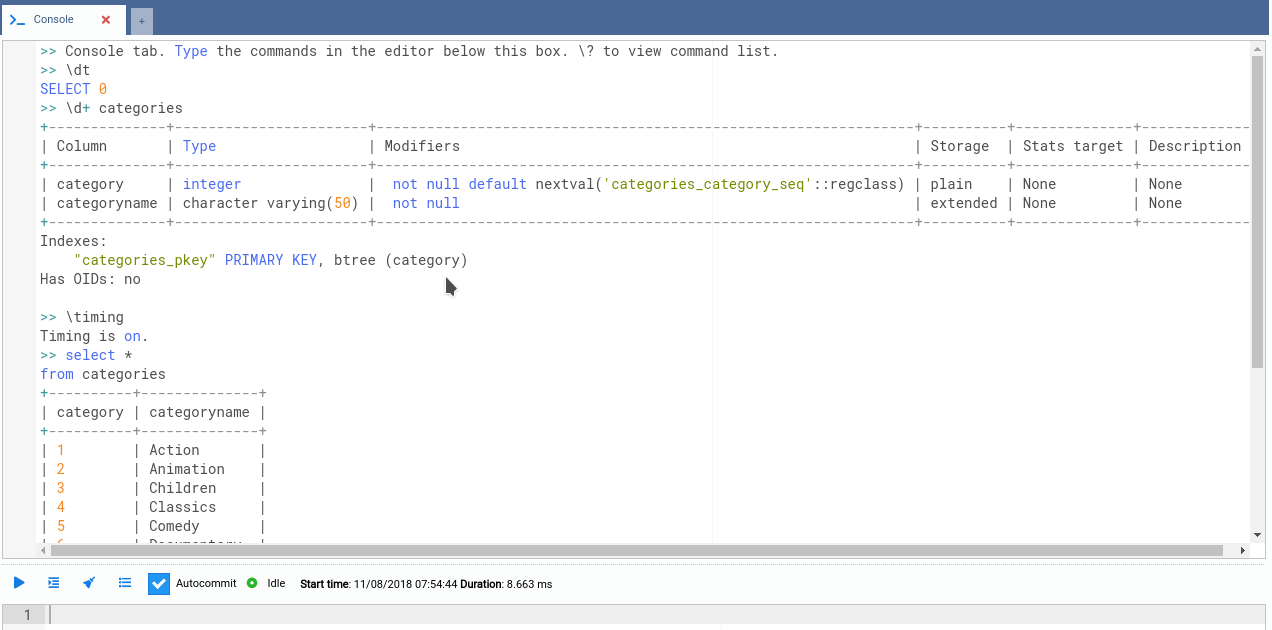
Or, if you prefer the command-line feel, try the Console tab:

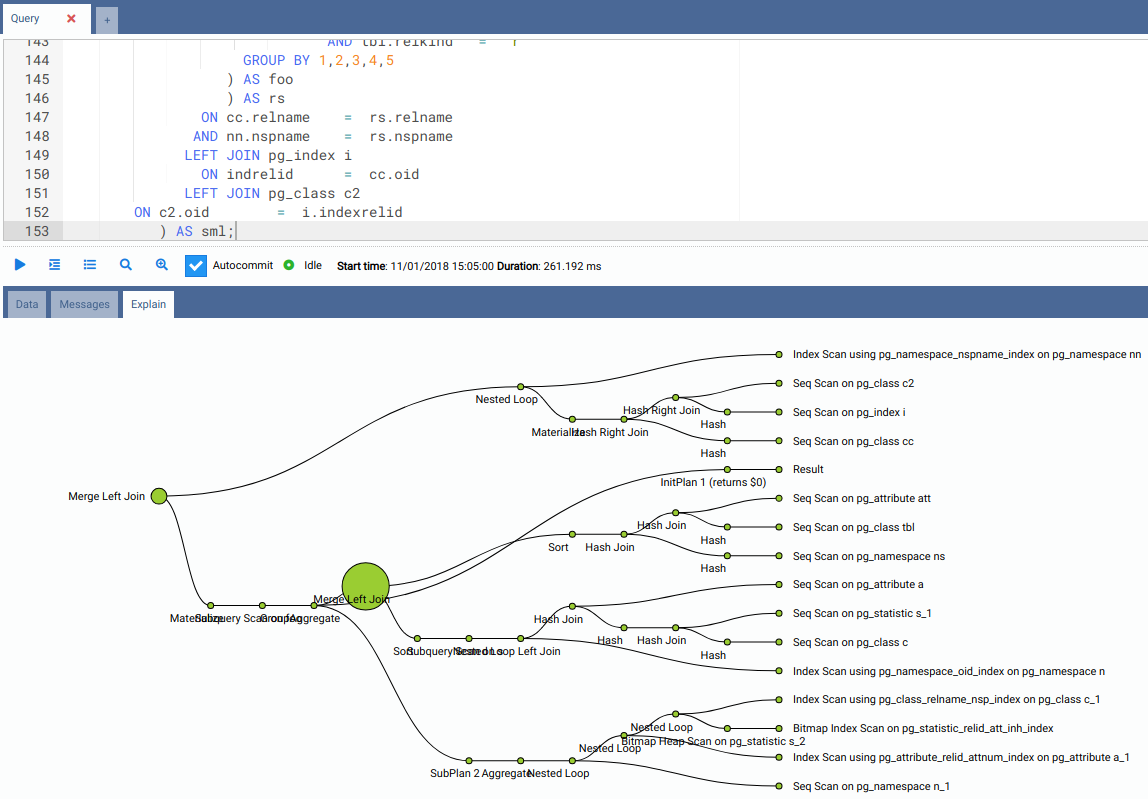
You can also visualize the query plan:

Administrators in OmniDB can manage users graphically. The interface gives you the ability to add, edit, and remove users, along with the ability to make someone a superuser. These users can then create connections to PostgreSQL, MySQL, MariaDB, and Oracle—all managed through a unified web page. Connections can also be made via SSH tunnels:

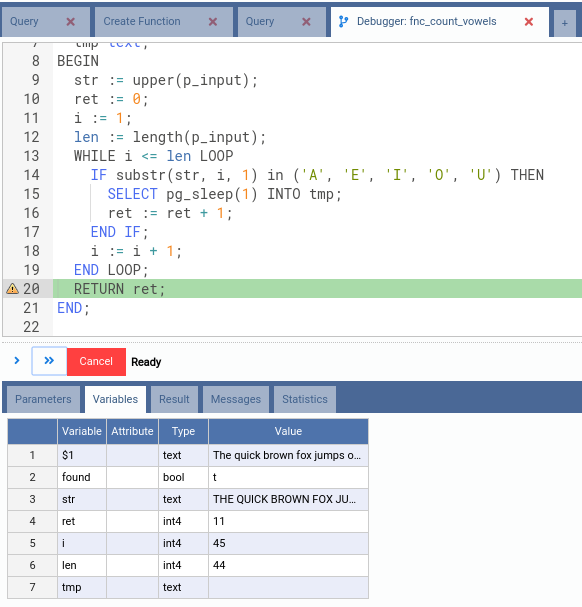
In order to ease the process of developing code in PL/pgSQL, OmniDB provides a powerful, full-featured debugger. The debugger works as an inner tab of the SQL Editor and provides insights into parameters, variables, result, messages, and statistics in five tabs:

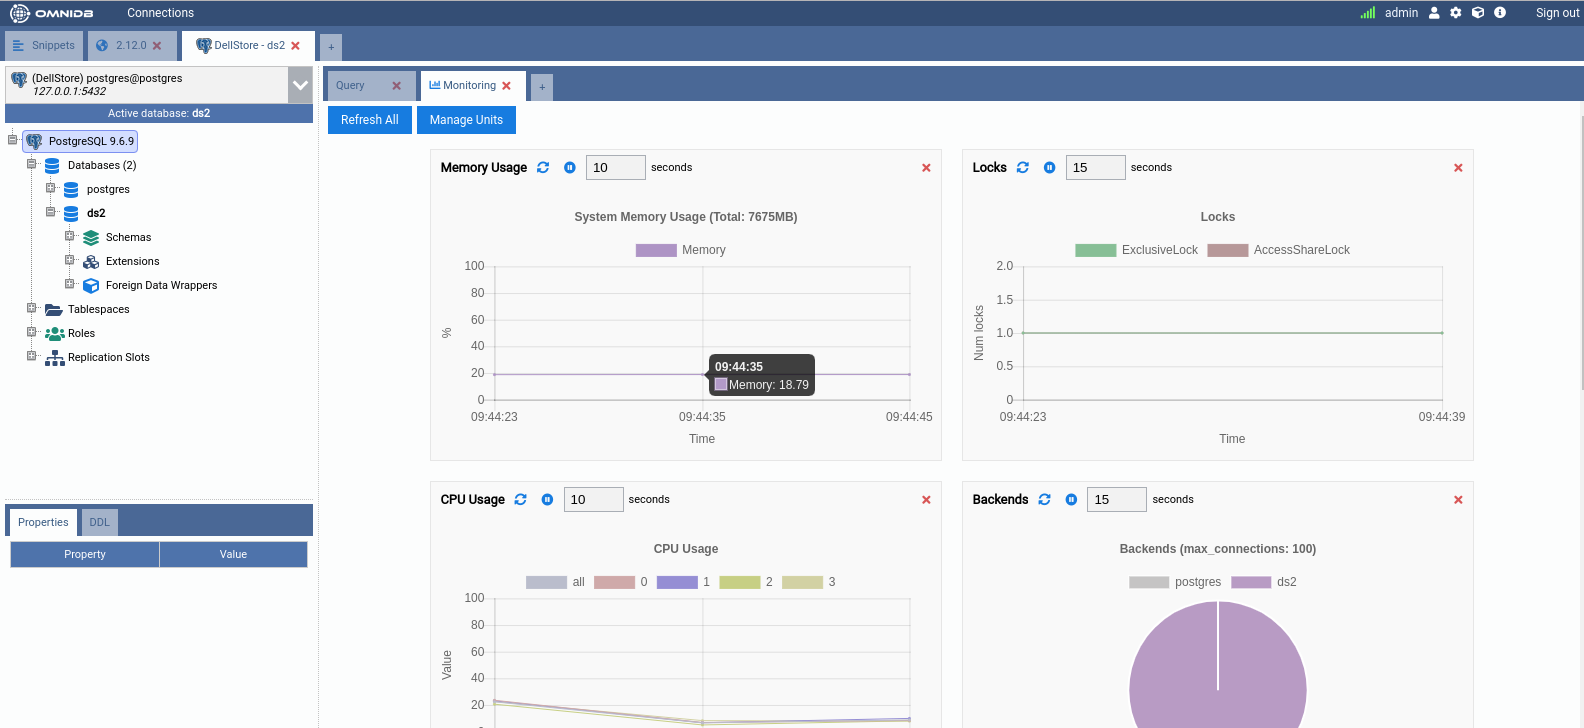
Another useful feature in OmniDB is the monitoring dashboard. The dashboard gives you real-time statistics of important metrics you might want to monitor, such as system Memory Usage, CPU Usage, and Locks:

OmniDB has been designed to be a flexible and an extensible tool. Though it comes with several default charts, you can use Python and JSON to write new ones or use the existing ones as templates to enhance and expand. OmniDB provides a plugin API, allowing users to write and distribute their own plugins for expanded capabilities.


