An introduction to data literacy
So what is data literacy, and what does it mean to know how to use data? If we type data literacy into Google’s search box, we will get a lot of results.

Figure 1.6 – Google search for data literacy
We and others think that the definition of data literacy is: The ability to work with, analyze & argue with data…
From our point of view, we’d like to add that it means how a person uses data and understands the world around him (or her). It’s also a matter of behavior, that people can work with data not because they must, but because they want to!
In his article The Art of Questioning, Kevin Hanegan explains the vital role questions play in data literacy:
“Asking the right questions of your data and knowing what you want to find is a key part of getting insights from your data that lead to specific actions.”
Data isn’t just black and white; you can do a lot with it. So, two people who look at the same data can come to very different conclusions. This is because a lot depends on the problem you’re trying to solve and how you go about solving it. This is where communication comes in as a key soft skill. For that decision-making process, we need both technical skills (hard skills) and soft skills such as collaboration, organizational sensitivity, communication, and so on.
We’ll use the pandemic, the news, the data, and the choices we and others had to make as examples in the next section and the later chapters.
The COVID-19 pandemic
To start learning about data literacy, we could look at some examples we’ve gathered from the news and different government organizations around the world.

|
When we look at the headlines in this picture, we might be surprised to see that only 2,000 of the 550,000 NHS workers were tested. And the headline next to it: “As two more brave doctors die, the same headline tells a story that only 0.16% of NHS staff have been tested for the virus and that the testing station is empty.” At first, we were all scared about what was going on in our world. There was no information about the topic, and there were no tests available. We saw every day, sad and horrifying news and stories told of people dying and being taken to the hospital, and that hospitals were full of people suffering from COVID-19. |
Figure 1.7 – COVID-19 headlines
If we read those headlines without questioning them, it paints a scary picture. But what if you asked questions such as:
- Why are these numbers like this?
- What does being tested mean?
- What is a positive or a negative test?
- What does the 0.16% mean?
- Compared with what?
- Can I trust this message?
- Which sources did they use? And so on.
All of this is based on the idea that we need to think carefully about what we think and how we should act on that. When we look at some news stories about the COVID-19 pandemic, we can see that there are many kinds of articles. Some are loud (with big headlines) and others are written in a calm way. It depends on which newspaper you read.
A basic understanding of data literacy
We’ll walk through how to read a news story so we can start to understand how to use data to better understand the world around us. In this made-up example, we see how we can interact with data when we read the news online or in a paper news magazine.
Note that this news article is a mix of fact and fiction.

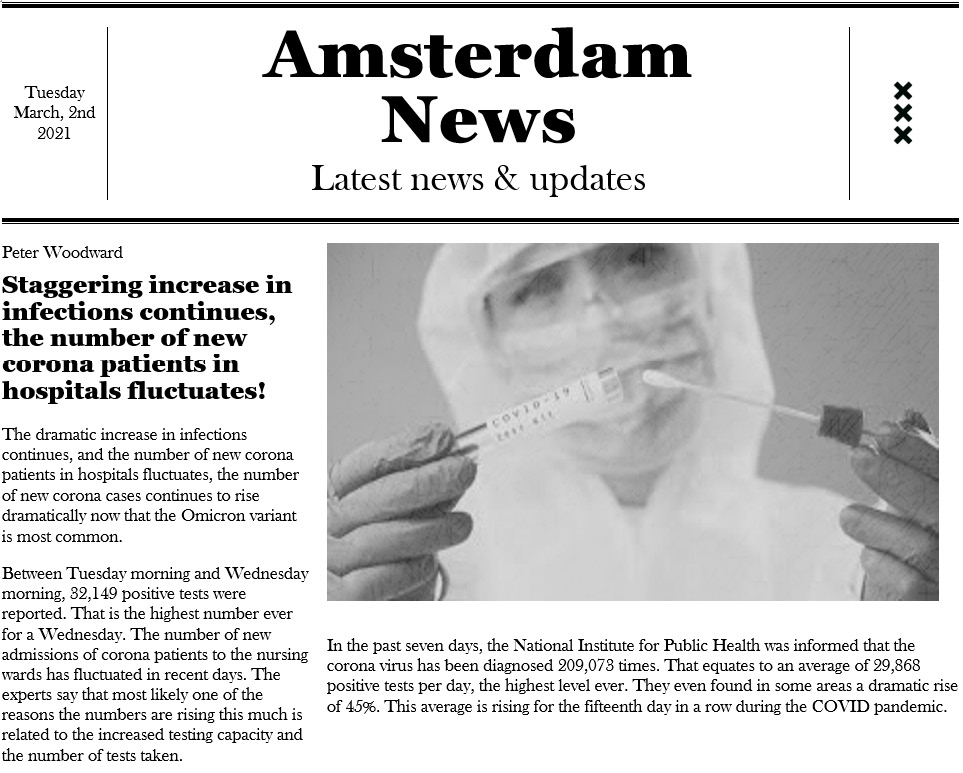
Figure 1.8 – News article about the COVID-19 pandemic
From what we can see and read, this article seems to be written for a wide range of people. If you look a little closer, the article also has data elements. These facts and figures can be hard to understand, and someone who doesn’t have the right skills to do so might miss some important points in this news story. They might get the news wrong, and some people might even be scared by what they read. In all honesty, the same thing has happened all over the world. Most likely, everyone who reads this kind of article could have some questions such as:
- Am I safe?
- Should I stay in my house and not go outside?
- Shall I order my groceries online?
- Can I visit my mom and dad?
- Shall we invite people to our houses or not? And so on.
If we take out the information such as the figures we see in this news story, it might make more sense.

Figure 1.9 – News article removing data elements
We would understand more if we read the news article carefully and paid more attention to the facts.
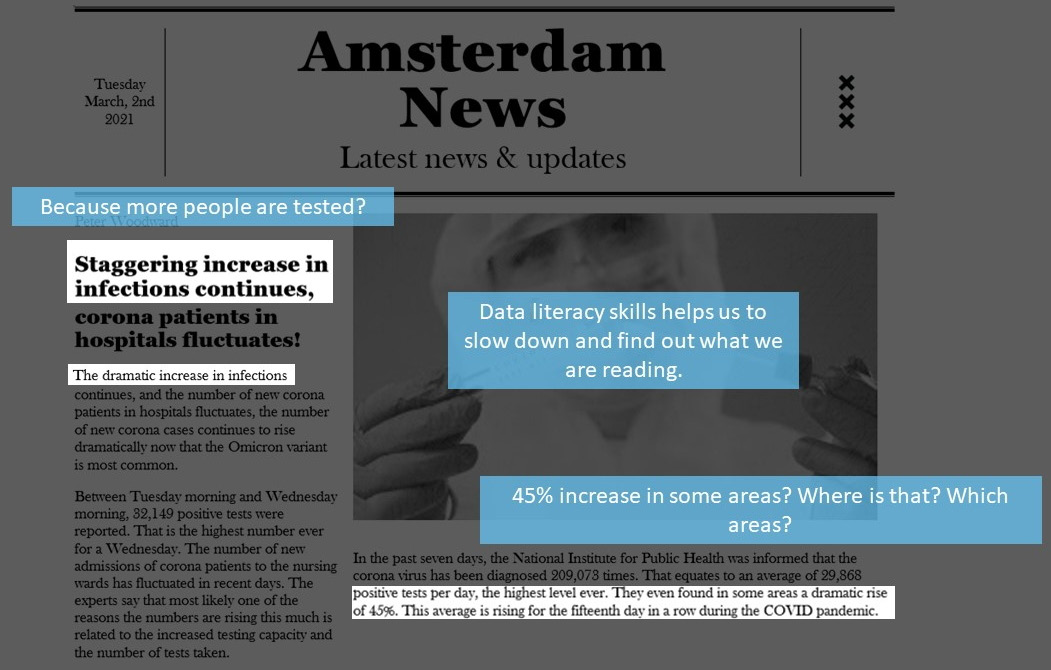
We can read that the “new positive cases are increasing.” But as stated in the article, that “could be the result of the expansion of test locations.” We can draw the first conclusion that the increase in people who tested positive could be the result of expanding the test capacity.

Figure 1.10 – Questioning the news article to understand the message better.
But there’s more to read in this article. If we keep reading, we’ll see that there’s more clutter and noise. Let’s talk about the mess and noise in the next section.
Removing emotions and asking questions
Some of the things in the article being shown are emotional. Words such as staggering, dramatic, dramatically, and highest level ever can make us feel scared, but they also make us biased. By being able to get rid of these parts, we can read the article again and get rid of the clutter and feelings.
Most of the time, we start by coming up with questions and then looking for answers (or feedback) that will help us make decisions. Knowing which data is useful for answering our questions is also an important part of our data literacy skills. In this situation, we could ask things such as the following:
- How does the pandemic affect me?
- Can I go and visit my parents or my family?
- What do I have to take care of?
- Will our business survive?
- What are some areas and is this here in my hometown?
- What is a test, and what does being positive or negative mean? And so on.
As questions are an amazingly important aspect of our data literacy skill set, you will find more information in Chapter 8, Questioning the Data.
We use and see a lot of data in our everyday lives. Everyone needs to know how to read and understand data. Even during a pandemic and while reading the news, we need to be able to tell what information is useful and what is not. This is what we call critical thinking. Critical thinking is part of data literacy; it is the ability to question the logic of arguments or assumptions and examine evidence in order to determine whether a claim is true, false, or uncertain. In Chapter 8, Questioning the Data, we talk more about questioning. When COVID-19 hit us, at first, we mostly felt fear, hopelessness, and uncertainty, and we had many questions. As soon as the first cases came in, the first people were taken to the hospital or even the ICU. During the pandemic, we realized that we really needed to understand what data was and how we could use it to decide what to do or how to respond to the crisis. During this global crisis, we felt like we had to find out what was going on right away.
We needed to know and understand what was going on around the world. For example, we needed to know how many tests were being done, how many people were losing their jobs, and so on.
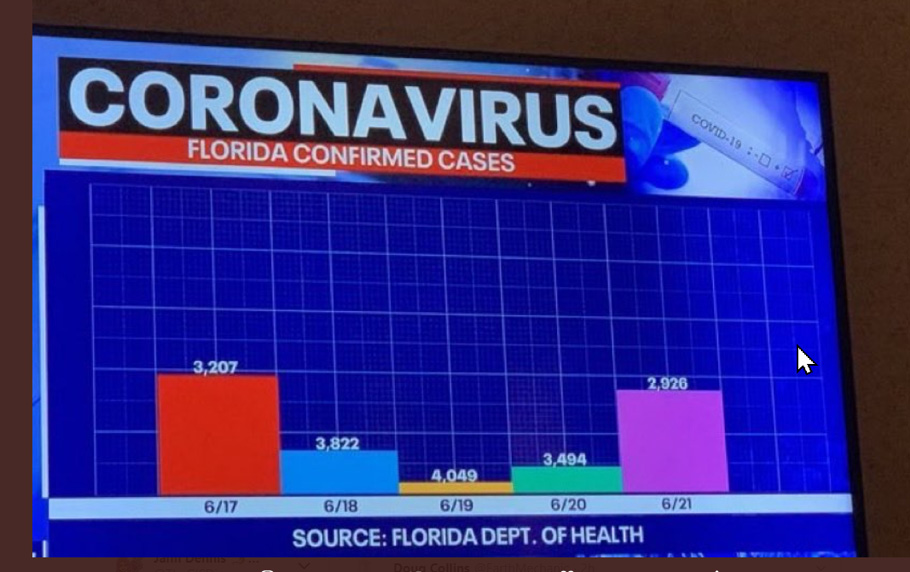
During the crisis, it was hard because some people also gave us false information. Some said all sorts of things that didn’t make sense. In the following figure, you can see a picture that our friend Joe Warbington took of his TV.

Figure 1.11 – Misleading graphs on TV
You may have noticed that the graph is a little strange, with high numbers and a small bar and low numbers and a bigger bar. We don’t see any other information or context on the axes. People take the graph for granted instead of being critical and asking questions, which is a worry.
Noticing the problems with the graph and identifying that there are things wrong with it are an important part of your data literacy skills.
From here, we can learn the basics of data and how we can use it in our daily lives. Organizations also need data, and they need to know how to use data and be literate in data. So, let’s look at the organizational data flow next to better understand this.


