Choosing a chart requires knowing your data. Charts are a means of communication aimed at revealing information, so the main question is: what do you want to show? Once you've answered that question, you should analyze your data and discover what kind of data you have. Data values used in visualizations can usually be classified as one of these three types:
- Quantitative: A value that can be measured or counted (a number, a length, an area, an angle)
- Ordinal: A value can be ranked or compared (color saturation, area, angle, length, words)
- Nominal: A category (a name)
What is the purpose of you chart? Do you wish to reveal relationships, trends, or causality? What kind of relationship do you wish to emphasize? Do your variables relate to time or space?
Visualizations can be organized into categories, which make it easier to choose the kind of chart you need. Most charts and maps can be placed in one of these categories:
- Time-series (plots a single variable over a period of time). For example, a line chart that demonstrates a trend.
- Temporal/linear (categories placed in a time-line). For example, a series of events.
- Spatial/planar/volumetric (categories distributed in a spatial map). For example, a cartogram or choropleth with data distributed on a geographical map.
- Comparison (categories associated with quantities are compared and ranked during a single period). For example, a bar chart that compares values.
- Part-to-whole (categorical subdivisions as ratio to a whole). For example, a pie chart with slices as percentages.
- Correlation (comparing two or more variables). For example, a scatterplot comparing two variables, or a bubble chart comparing three.
In his classic book, The Visual Display of Quantitative Information, Edward Tufte defines some aspects that can be used to measure the quality and integrity of visualizations. They are the following:
- Data-ink ratio: The amount of ink (or pixels) dedicated to the data shown
- Chartjunk: Visual garbage that is irrelevant to the data shown (and that frequently get in the way)
- Lie factor: A number that measures the integrity of a visualization; for example, charts that lie by not representing proportions and lengths with enough precision
The data-ink ratio can be improved by removing chart-junk such as unnecessary lines and labels from charts. Sometimes the lines are important for context, but in interactive Web visualizations you can be very minimalistic. You can always provide details of demand with tooltips or other interactive resources.
Communication is deeply affected by the way humans perceive graphics, and may be improved or distorted by optical illusions. There are no charts with a lie factor of zero, but an adequate choice can improve it significantly. A bad choice increases the lie factor and can induce viewers to false perceptions.
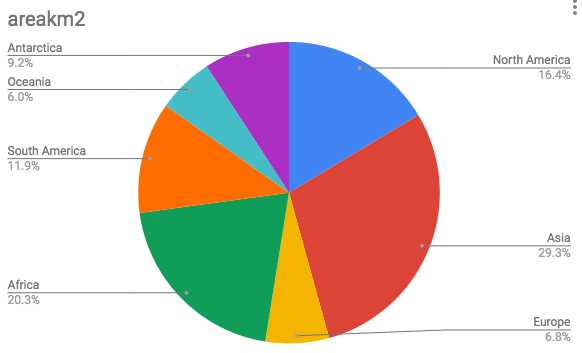
Position and length are best for representing quantitative information. Direction and angles come next, then area, volume, curvature, and finally shadows, saturation, and color. Since lengths and positions are easier to perceive and compare than angles and areas, data in a bar chart is perceived with greater accuracy than the same data in a pie chart. Consider the following pie chart, which compares the areas of continents:

A pie chart comparing areas of continents
Now look at the exact same data represented in a bar chart:
A bar chart comparing areas of continents
Which one is clearer? While the pie chart is good for showing proportions, angles are much harder to compare. Differences in length are much easier to compare and a bar chart is better in this case. But it would probably be clearer to use a pie chart to compare two values as part of a whole, such as the area of one continent compared to the remaining area, to reveal the proportion of land it occupies compared to the rest of the planet.
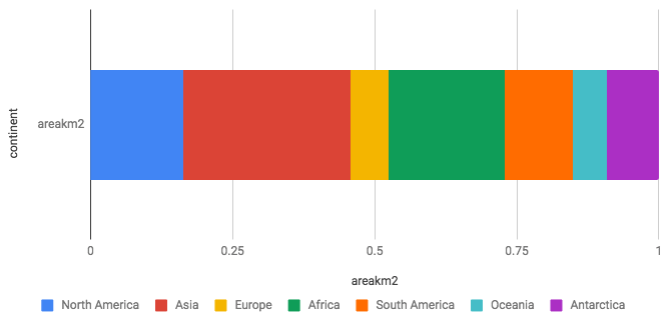
To have both proportions and lengths, you might be tempted to try a single stacked bar chart, but it still rates worse than the simple bar chart, since stacked bars aren't as easy to compare as when they are placed side-by-side:

A stacked bar chart comparing areas of continents
Of course, you can choose a chart for other reasons, but it's important to know what you lose and gain in each case. Analytic and exploratory visualizations require a high degree of accuracy, but you might want to use a more attractive visualization at the price of losing some accuracy if you need to capture the attention of your audience.


