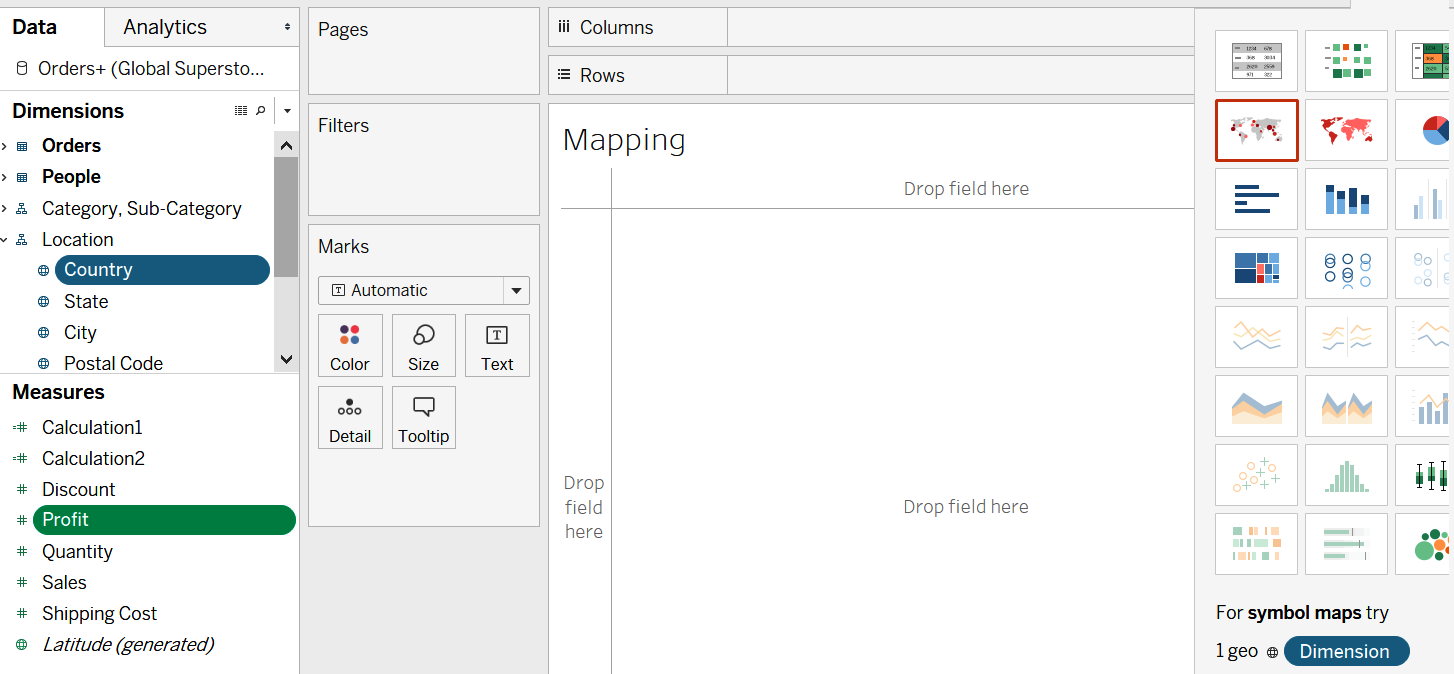
Mapping in Tableau is very simple and based on geographic data fields that can be identified by the globe symbol next to them. To create a map, select the geographic fields and any measure, and then click on the Show Me Window. As you can see in the following screenshot, Tableau automatically highlights the symbol map as the preferred visual:

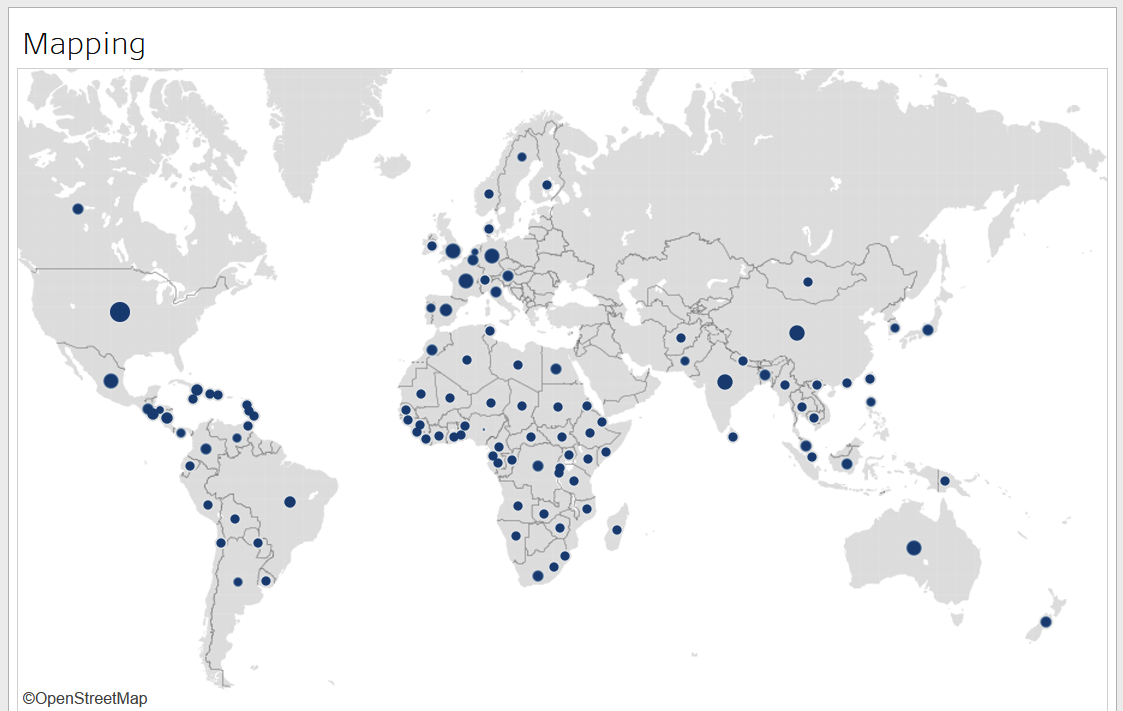
Once you click it, it will create the following screenshot. As you can see, for each country, the symbol marks a point at the geographic center of the location:

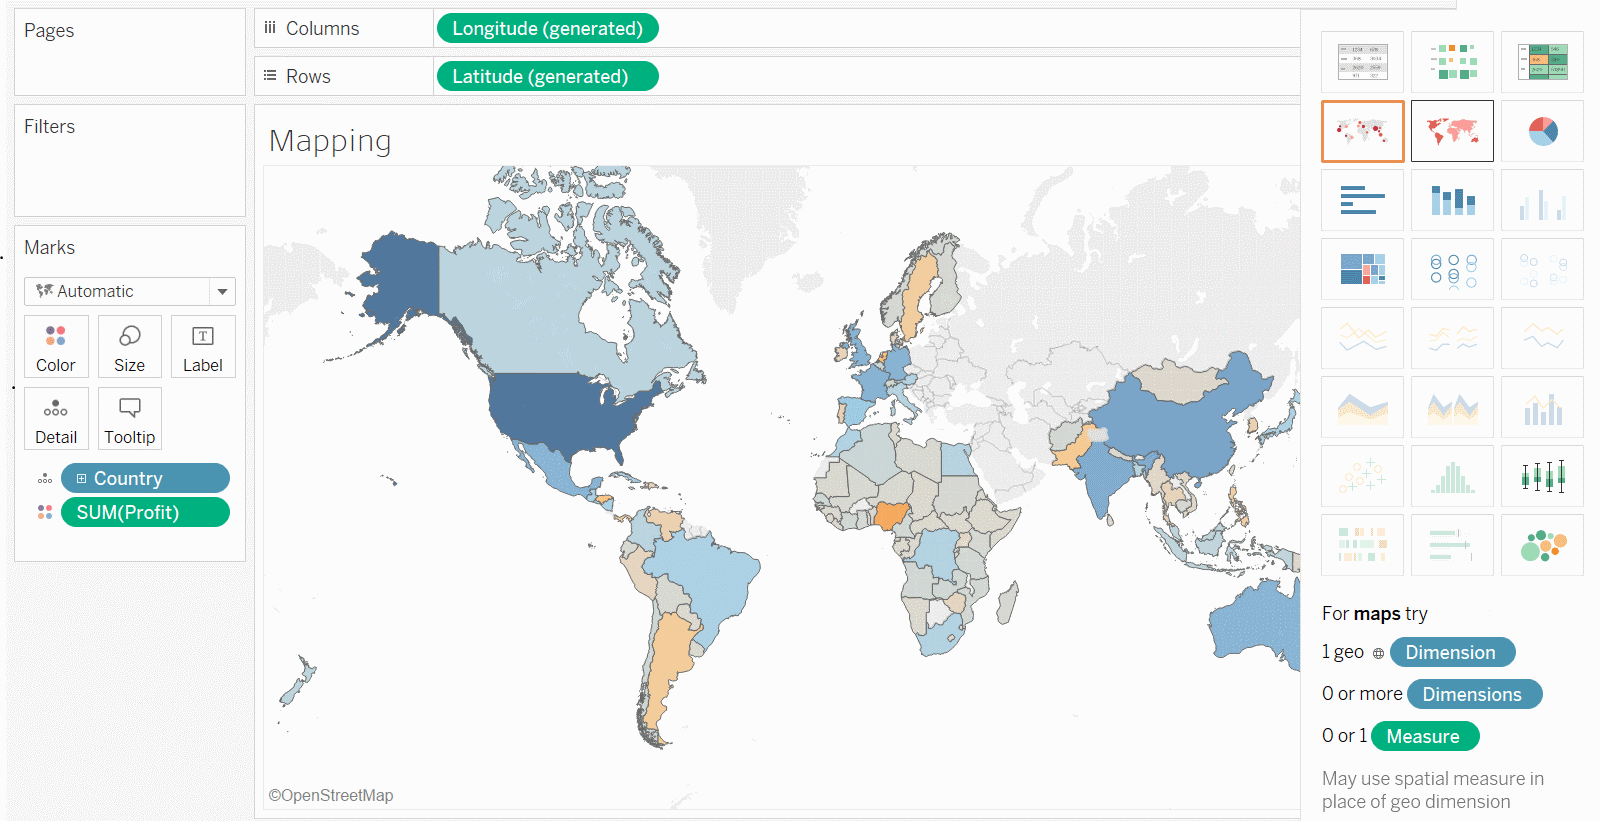
Symbol maps always plot marks at the geographic centers and can plot two measures at a time. Filled maps, on the other hand, use geographic locations to define the boundaries within which to fill and can only plot one measure at a time. Using the Show Me menu, if we now switch to filled maps, we can see the following screenshot:

If there are no geographic fields...


