Search icon CANCEL
Subscription
0
Cart icon
Your Cart (0 item)
Close icon
You have no products in your basket yet
Arrow left icon
Explore Products
Best Sellers
New Releases
Books
Videos
Audiobooks
Learning Hub
Free Learning
Arrow right icon
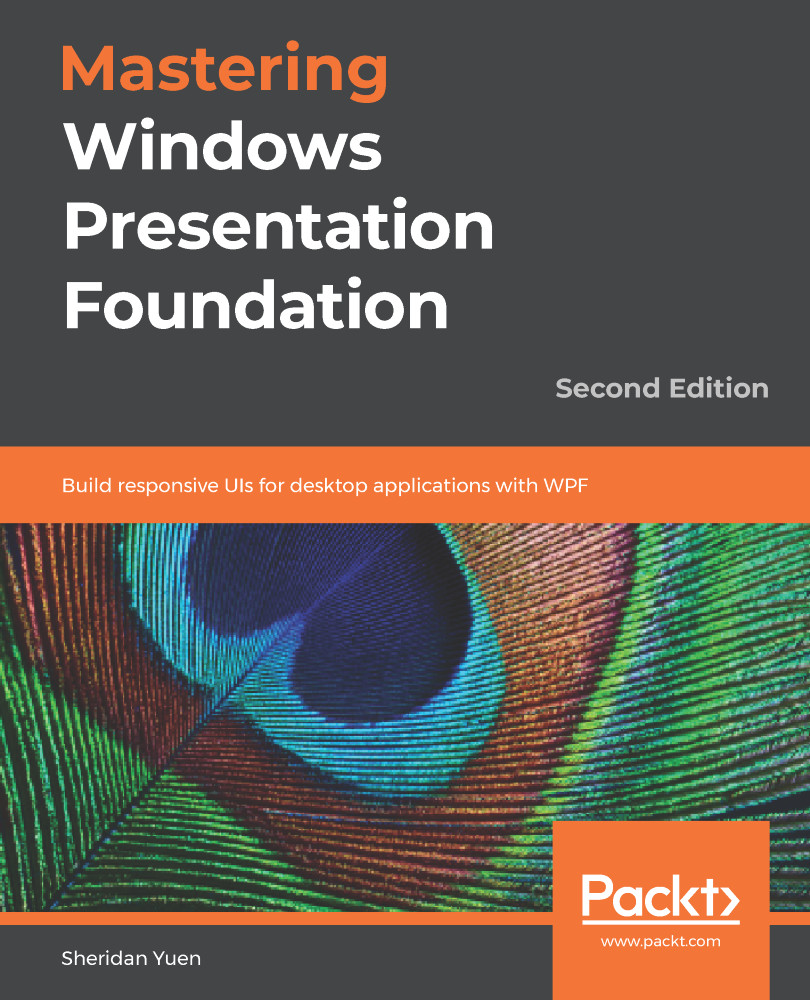
Mastering Windows Presentation Foundation

Mastering Windows Presentation Foundation: Build responsive UIs for desktop applications with WPF , Second Edition

eBook
₱1571.99 ₱2245.99
Paperback
₱2806.99
Subscription
Free Trial

What do you get with eBook?

Product feature icon Instant access to your Digital eBook purchase
Product feature icon Download this book in EPUB and PDF formats
Product feature icon Access this title in our online reader with advanced features
Product feature icon DRM FREE - Read whenever, wherever and however you want
Product feature icon AI Assistant (beta) to help accelerate your learning
OR
Modal Close icon
Payment Processing...
tick Completed

Billing Address

Table of content icon View table of contents Preview book icon Preview Book

Mastering Windows Presentation Foundation

Debugging WPF Applications

When our WPF programs don't work as expected, we need to debug them, as we would with any other language. However, at first it can seem to be a daunting task, as WPF is very different from other languages. For example, when declaring a Dependency Property, we normally add a CLR property wrapper for convenience. However, the WPF Framework won't call it when the property value is changing, so we'd wait a long time for a break point in that setter to be hit.

When we're testing our newly developed code, we need to be able to check the values of our data bound properties, and there are a number of ways to do that, although some are far from obvious. In this chapter, we'll investigate a number of important sources of information to help us to locate the mistakes in our code.

We'll discover a variety of tactics to help us when debugging the data bound values and find out how to track down the actual cause of a problem when faced with the dreaded XamlParseException. We'll cover all of these topics in detail shortly, but for now, let's first start with the absolute basics.

Utilizing the Output window

When we've made changes to our XAML, but don't see what we are expecting to see in the UI, the first place to look for errors is in the Output window of Visual Studio. If this window is not already visible, then you can display it by selecting the Output option from the View menu or by pressing Ctrl + W and then O.

However, if you have a binding error, but don't see any reference to it in the Output window, it could be because your Visual Studio is not currently set up to output debug information to it.

You can turn this functionality on in the Visual Studio Options dialog window, by navigating to Tools | Options | Debugging | Output Window | General Output Settings.

The General Output Settings section has several options that you can turn on and off. The most important ones are All debug output and Exception Messages, but it is generally good practice to leave them all set to On. When set, binding errors will be displayed in the Output window in the following format:

System.Windows.Data Error: 40 : BindingExpression path error:
'ViewName' property not found on 'object' ''MainViewModel'
(HashCode=3910657)'. BindingExpression:Path=ViewName;
DataItem='MainViewModel' (HashCode=3910657); target element is 'TextBox'
(Name='NameTextBox'); target property is 'Text' (type 'String')

Let's take a closer look at this error. The plain English translation for this would be as follows:

  • There is no public property named ViewName in the object of type MainViewModel with a HashCode value of 3910657
  • The error was raised from a Binding.Path value that was specified as ViewName, which was set on the Text property of a TextBox instance named NameTextBox

This could be rewritten with descriptive names rather than specific details, like this:

System.Windows.Data Error: 40 : BindingExpression path error: 'PropertyOfBindingSource' property not found on 'object' ''TypeOfBindingSource' (HashCode=HashCodeOfBindingSource)'. BindingExpression:Path=UsedBindingPath; DataItem='TypeOfBindingSource' (HashCode=HashCodeOfBindingSource); target element is 'TypeOfBindingTarget' (Name='NameOfBindingTarget'); target property is
'PropertyOfBindingTarget' (type 'TypeOfBindingTargetProperty')

Now that we have our 'key' to explain what these values represent, we can see that they are really very descriptive. Not only are we provided with the name of the data bound UI control, if it is set, and the used binding path, but also the type of the data source, along with the hash code of the actual instance of that type that is being used.

These errors highlight the mistakes that have been made in the XAML files. The type of errors displayed in this window will include incorrectly labeled binding paths, such as ones using non-existent property names, or otherwise invalid binding source paths. While it won't catch every problem, there is a way to make it output additional information that could help us to track down our more elusive problems.

In order to do this, first display the Options dialog window, then navigate to Tools | Options | Debugging | Output Window | WPF Trace Settings.

Here, you can find a number of options, each with a variable level of output: Animation, Data Binding, Dependency Properties, Documents, Freezable, HWND Hosting, Markup, Name Scope, Resource Dictionaries, and Routed Events. The various levels of output and their meanings are as follows:

  • Critical: Enables tracing of Critical events only
  • Error: Enables tracing of Critical and Error events
  • Warning: Enables tracing of Critical, Error, and Warning events
  • Information: Enables tracing of Critical, Error, Warning, and Information events
  • Verbose: Enables tracing of Critical, Error, Warning, Information, and Verbose events
  • ActivityTracing: Enables tracing of Stop, Start, Suspend, Transfer, and Resume events

It is fairly common to permanently have the Data Binding option set to Warning or Error, with the other options set to Off. The general rule of thumb when using these options is to use the minimum level required, except when trying to find problems, because they will slow down the running of the application. It should be noted however, that this extra debug trace output will not affect Release builds at all.

If you set the Data Binding entry to an output of Verbose or All and look in the Output window when running your application, you will understand why it will negatively affect performance. Even when not displaying this debug information in the Output window, the WPF Framework will still be performing a great number of checks when there are binding errors. It is, therefore, very important to clear up all errors and warnings that are displayed, to minimize the amount of work that the Framework does when trying to resolve them.

Putting Presentation Trace Sources to work

As useful as it is, there are certain occasions when using the Output window will not suffice. Perhaps we have far too much output to look through now and would like to view it on the way home from work, or maybe we need to see this kind of debug trace information after our application has been deployed. In these cases and others, it's time to enable the WPF Presentation Trace Sources.

There are a number of different trace sources that we can employ to output detailed tracing data for us. The choice is the same as that found in the WPF Trace Settings options and in fact, after setting the values there, the Output window has already been showing us the debug trace output.

By default, WPF uses a DefaultTraceListener object to send the information to the Output window, but we can override that and/or configure the output to be sent to a text and/or XML file instead or as well.

In order to do this, we need to alter our app.config file, which is found in the root folder of our startup project. We'll need to add a system.diagnostics section and within it, add sources, switches, and sharedlisteners elements. The switches element holds the switch that determines the output level, as specified in the previous section.

The sharedlisteners element specifies which kind of output we want to utilize. The three types are:

  • System.Diagnostics.ConsoleTraceListener: Sends the traces to the Output window
  • System.Diagnostics.TextWriterTraceListener: Outputs to a text file
  • System.Diagnostics.XmlWriterTraceListener: Outputs to an XML file

Finally, we need to add a source element for each trace source that we want to listen to, and specify which switch and listener we want to use with it. Therefore, we are able to output different trace sources to different media and with different levels of output. These trace sources are the same as those found in the WPF Trace Settings options, although in the configuration file, we need to specify their full names.

The choices are as follows:

  • System.Windows.Media.Animation
  • System.Windows.Data
  • System.Windows.DependencyProperty
  • System.Windows.Documents
  • System.Windows.Freezable
  • System.Windows.Interop.HwndHost
  • System.Windows.Markup
  • System.Windows.NameScope
  • System.Windows.ResourceDictionary
  • System.Windows.RoutedEvent
  • System.Windows.Shell

Let's see an example configuration file:

<?xml version="1.0" encoding="utf-8"?> 
<configuration> 
  <startup>  
    <supportedRuntime version="v4.0" sku=".NETFramework,Version=v4.6.1" /> 
  </startup> 
  <system.diagnostics> 
    <sources> 
      <source name="System.Windows.Data" switchName="Switch"> 
        <listeners> 
          <add name="TextListener" /> 
        </listeners> 
      </source> 
    </sources> 
    <switches> 
      <add name="Switch" value="All" /> 
    </switches> 
    <sharedListeners> 
      <add name="TextListener"  
        type="System.Diagnostics.TextWriterTraceListener"  
        initializeData="Trace.txt" /> 
    </sharedListeners> 
    <trace indentsize="4" autoflush="true"></trace> 
  </system.diagnostics> 
</configuration> 

Focusing on the system.diagnostics section from the example, we see that there is one source element that is specifying the System.Windows.Data source (for data binding information), the switch named Switch, and the TextListener listener. Looking first in the switches section, we find the switch named Switch and note that it is set with an output level of All.

Below this, in the sharedlisteners element, we see the listener named TextListener. This listener is of type System.Diagnostics.TextWriterTraceListener and this outputs to a text file which is specified by the value of the initializeData attribute. We end with a trace element that sets the tab size of the text document to four spaces and ensures that data is flushed out of the buffer after each write, to prevent trace data from being lost due to a crash.

To set a less verbose output, we can simply alter the switch to use one of the other levels of output, as follows:

<add name="Switch" value="Error" /> 

As mentioned earlier, WPF can use a DefaultTraceListener object to send trace information to the Output window when particular options are set in Visual Studio. The name of this listener is Default. In order to stop the default behavior of this DefaultTraceListener, we can remove it using our source element, as follows:

<source name="System.Windows.Data" switchName="Switch"> 
  <listeners> 
    <add name="TextListener" /> 
    <remove name="Default" /> 
  </listeners> 
</source> 

It's good to be aware of this fact, because if we also configured our own ConsoleTraceListener object, we could end up with our Output window duplicating trace events. However, it is also possible to add multiple listeners into each source element if required:

<source name="System.Windows.Data" switchName="Switch"> 
  <listeners> 
    <add name="TextListener" /> 
    <add name="OutputListener" /> 
  </listeners> 
</source> 

We can also add different listeners for different sources:

<source name="System.Windows.Data" switchName="Switch"> 
  <listeners> 
    <add name="TextListener" /> 
  </listeners> 
</source> 
<source name="System.Windows.DependencyProperty" switchName="Switch"> 
  <listeners> 
    <add name="OutputListener" /> 
  </listeners> 
</source> 
... 
<sharedListeners> 
  <add name="TextListener"  
    type="System.Diagnostics.TextWriterTraceListener"  
    initializeData="Trace.txt" /> 
  <add name="OutputListener"  
    type="System.Diagnostics.ConsoleTraceListener" /> 
</sharedListeners> 

Different output levels for different sources can be added as follows:

<source name="System.Windows.Data" switchName="ErrorSwitch"> 
  <listeners> 
    <add name="TextListener" /> 
  </listeners> 
</source> 
<source name="System.Windows.DependencyProperty" switchName="AllSwitch"> 
  <listeners> 
    <add name="OutputListener" /> 
  </listeners> 
</source> 
... 
<switches> 
  <add name="AllSwitch" value="All" /> 
  <add name="ErrorSwitch" value="Error" /> 
</switches> 

One neat feature that WPF Presentation Trace Sources provide is the ability to create our own custom trace sources:

<source name="CompanyName.ApplicationName" switchName="Switch"> 
  <listeners> 
    <add name="TextListener" /> 
  </listeners> 
</source> 

Note that the DefaultTraceListener was already configured to send information to the Output window in the WPF Trace Settings options mentioned in the previous section, so the traces from this source will also be sent to the Output window automatically. If you have not set those options, but want to view the trace output there, then you will need to manually add a reference to the ConsoleTraceListener to this source, as shown in the preceding code snippets.

In code, we are now able to output custom trace information to this source:

TraceSource traceSource = new TraceSource("CompanyName.ApplicationName");
traceSource.TraceEvent(TraceEventType.Information, eventId, "Data loaded"); // Alternative way to output information with an event id of 0 traceSource.TraceInformation("Data loaded");

To specify different levels of importance, we use the TraceEventType enumeration:

traceSource.TraceEvent(TraceEventType.Error, eventId, "Data not loaded"); 

After outputting the debug information, we can optionally flush the existing listeners to ensure that they receive the events in the buffers before continuing:

traceSource.Flush(); 

Finally, we need to ensure that we close the TraceSource object to free resources when we have outputted the necessary information:

traceSource.Close(); 

The best part of this tracing functionality is the fact that we can turn it on and off using the configuration file, either at design time, runtime, or even on production versions of the application. As the configuration file is basically a text file, we can manually edit it and then restart the application so that it reads the new configuration.

Imagine that we had two switches in our file and that our default configuration used the switch named OffSwitch, so that there was no tracing output:

<source name="CompanyName.ApplicationName" switchName="OffSwitch"> 
  <listeners> 
    <add name="TextListener" /> 
  </listeners> 
</source> 
...
<switches> <add name="AllSwitch" value="All" /> <add name="OffSwitch" value="Off" /> </switches>

Now imagine that we have deployed our application and it is installed on a user's computer. It's worth noting at this point that the actual deployed configuration file that is created from the app.config file will have the same name as the executable file. In our case, it would be named CompanyName.ApplicationName.exe.config and would reside in the same folder as the executable file.

If this installed application was not behaving correctly, we could locate this configuration file, and simply change the switch to the one named AllSwitch:

<source name="CompanyName.ApplicationName" switchName="AllSwitch"> 
  <listeners> 
    <add name="TextListener" /> 
  </listeners> 
</source> 

After restarting the application, the new configuration would be read and our custom traces would be written to the specified text file. One alternative to restarting the application would be to call the Refresh method of the Trace class, which has the same effect of initiating a new read of the configuration file:

Trace.Refresh(); 

This method call can even be connected to a menu item or other UI control to enable tracing to be turned on and off without having to restart the application. Using either of these methods of refreshing the configuration file, we can attain important debug information from our software, even when it is in production. However, great care should be taken to ensure that text or XML file tracing is not permanently enabled on released software, as it will negatively affect performance.

While the WPF Presentation Trace Sources are typically available by default these days, in a few cases, we may need to manually enable this tracing functionality by adding the following registry key:

HKEY_CURRENT_USER\Software\Microsoft\Tracing\WPF 

Once the WPF registry key has been added, we need to add a new DWORD value to it, name it ManagedTracing, and set its value to 1. We should then have access to the WPF Presentation Trace Sources. We've now seen a number of ways of finding the information that we need at runtime, but what about if the application won't even run?

Discovering inner exceptions

When we are building the content of our Views, we often make the odd typographical mistake here and there. Perhaps, we mistype the name of one of our properties in a binding path, or copy and paste some code that references other code that we have not copied.

At first, it may appear to be quite difficult to find the source of these types of errors, because when we run our application, the actual error that is raised by Visual Studio is usually of type XamlParseException and bares no direct relation to the actual error. The additional information provided is also of little help. Here is a typical example:

Let's investigate this further. We can see that the additional information supplied here says:

'Provide value on 'System.Windows.Markup.StaticResourceHolder' threw an exception.' Line number '48' and line position '41'.

Now let's try to break this down to some meaningful information. Firstly, it is clear that the exception was thrown by the System.Windows.Markup.StaticResourceHolder class. By itself, this information is not very useful, but at least we know that the problem has something to do with a StaticResource that could not be resolved.

The next bit of information that we can gather from this message is that the problem occurred on line 48 and position 41. However, without informing us of which file this relates to, this information is also not very useful.

The Exception dialog window shown in the preceding screenshot will often have a line pointing to the line and position in the current file, which can also be another red herring. In this particular case, it was indeed false information as there was no error there, but at least that tells us that the problem has not arisen from the current file.

The trick to finding out what caused the real problem that occurred is for us to click the View Detail... link in the window. This will open the View Detail window, where we can see all of the property values of the XamlParseException. Looking at the StackTrace and TargetSite property values won't help in the way that they usually do with normal exceptions. However, if we open up and inspect the InnerException property value, we can finally find out what actually happened.

Let's do that with our example:

At last, we have something that we can work with. The InnerException.Message property value states: "Cannot find resource named 'BaseButtonStyle'. Resource names are case sensitive".

Therefore, our offending object references the BaseButtonStyle style. A quick search for BaseButtonStyle through the solution files in Visual Studio will locate the source of the problem. In this case, our problem lay in the Application.Resources section of the App.xaml file. Let's take a closer look:

<Style x:Key="SmallButtonStyle" TargetType="{x:Type Button}" 
  BasedOn="{StaticResource BaseButtonStyle}"> 
  <Setter Property="Height" Value="24" /> 
  <Setter Property="Width" Value="24" /> 
</Style> 

Here we can see a style that is based on another style, but the base style is apparently missing. It is this missing base style that is the StaticResource named BaseButtonStyle that caused this error. We can fix this problem easily by either creating the referenced base style in the App.xml file, or by removing the BasedOn property from the SmallButtonStyle style.

We should always bear in mind that errors like these will most likely reside in the code that we have just been editing, so that also helps us to narrow down the search. It is therefore beneficial to run the application often when implementing XAML that may contain errors, as the more code we write between checking our progress, the more code we need to look through to find the problem.

Debugging data bound values

So far, we have seen that we can utilize a number of sources of information to help with tracking down the causes of our problems. However, what about actual debugging? In other GUI languages, we can add breakpoints at various locations in our code and watch our values changing as we step through our code. While we can also do this with WPF applications, it is not always so obvious where to put our breakpoints to ensure that program execution will hit them.

If you remember from the previous chapter, the CommandManager.RequerySuggested event is raised when the CommandManager class detects a change in the UI that could reflect on whether a command could execute or not. Well, it turns out that two of the conditions that the CommandManager looks out for is when the application window is either activated or deactivated and we can take advantage of this to help us when debugging. Note that the application window is deactivated when the user moves focus from it and is reactivated when the user returns focus to it.

Therefore, while running the application side by side with Visual Studio, we can put a breakpoint in any method that is being used as a canExecute handler for our ActionCommand class, thereby removing focus from the application. Now, when we click back on the WPF application, the focus will be returned to it.

This will cause the CommandManager.RequerySuggested event to be raised and as a result, the canExecute handler will be called and our breakpoint will be hit. This basically means that we are able to get the program execution into our View Models to debug parameter values any and every time that we need to. Let's see what else we can do to help fix our data binding errors.

Outputting values to UI controls

One of the simplest ways of working out what values our data bound properties have is to just data bind them to other UI controls that have a textual output. For example, if we have a collection of items and we want to do something with the selected item, but whatever that is isn't working, we need to verify that our binding to that selected item is correct.

To visualize the result of the binding, we can simply copy and paste the binding path to the Text property of a TextBox and run the application. If our binding path is correct, we'll see something output in the TextBox control and if not, we'll know that the problem that we're having is in fact, down to the binding path. We can therefore, use this method to verify that objects that don't normally have a textual output are at least correctly data bound or not.

This simple technique can help in any situation where the faulty data binding is not already rendered in a text-based UI control. For example, we might need to debug a data bound value because a particular visual effect that is created with a DataTrigger instance is not working and we need to determine whether the problem is related to the UI control or the data binding path.

Catching changing Dependency Property values

As we saw at the beginning of this chapter, the WPF Framework won't call the CLR property wrappers of our Dependency Properties when the property values are changing. However, there is a way to accomplish this using callback handlers. In fact, we've already seen an example of this when we were looking at the creation of the OnEnterKeyDown Attached Property. Let's remind ourselves what that looked like:

public static readonly DependencyProperty OnEnterKeyDownProperty =  
  DependencyProperty.RegisterAttached("OnEnterKeyDown", 
typeof(ICommand), typeof(TextBoxProperties),
new PropertyMetadata(OnOnEnterKeyDownChanged));

...
public static void OnOnEnterKeyDownChanged(
DependencyObject dependencyObject, DependencyPropertyChangedEventArgs e) { TextBox textBox = (TextBox)dependencyObject; if (e.OldValue == null && e.NewValue != null) textBox.PreviewKeyDown += TextBox_OnEnterKeyDown; else if (e.OldValue != null && e.NewValue == null) textBox.PreviewKeyDown -= TextBox_OnEnterKeyDown; }

For this Attached Property, we used a particular overload of the DependencyProperty.RegisterAttached method that accepts a PropertyMetadata object, which enabled us to assign a PropertyChangedCallback handler to the property. Note that there is an identical overload for the DependencyProperty.Register method for declaring Dependency Properties.

Program execution will enter these PropertyChangedCallback handlers each time their related Dependency Property changes and so, that makes them perfect for debugging their values. While we don't often need to attach these handlers, it only takes a moment to add one when we need to and they enable us to find out what's going on with the Dependency Property values at runtime.

Exploiting converters

If we're having a problem with a data binding that uses an IValueConverter to convert the data bound value from one type to another, then we can place a breakpoint into the Convert method of the converter. As long as we have correctly set up the converter, we can be sure that the breakpoint will be hit when the binding is evaluated at runtime. If it doesn't get hit, that will mean that we have not set it up correctly.

However, even when we are not already using a converter on a binding that is not displaying the value that we are expecting, we can still add one just for this purpose. We can either add an existing converter to the binding, if we have one of the relevant type, or we can create a simple converter specifically for the purpose of debugging and use that instead. Let's take a look at how we might do this:

[ValueConversion(typeof(object), typeof(object))] 
public class DebugConverter : IValueConverter 
{ 
  public object Convert(object value, Type targetType, object parameter,
CultureInfo culture) { if (Debugger.IsAttached) Debugger.Break(); return value; } public object ConvertBack(object value, Type targetType,
object parameter, CultureInfo culture) { if (Debugger.IsAttached) Debugger.Break(); return value; } }

As you can see from the preceding code snippet, it's a very simple implementation of the IValueConverter interface. We start by specifying that we are converting from object to object in the ValueConversion attribute, thereby outlining that we are not actually converting any data bound values in this converter. The rest of the class represents a typical converter class, but without any conversion code.

The only real point of interest here are the two calls to the Debugger.Break method from the System.Diagnostics assembly. When the program execution reaches either of these method calls, it will automatically break, just as if there were breakpoints set on these lines. Therefore, when using this converter, we don't even need to set a breakpoint; we can just plug it into the binding, run the program, and investigate the value of the value input parameter when the data bound value is changed.

It can be attached like any other converter:

xmlns:Converters="clr-namespace:CompanyName.ApplicationName.Converters; 
  assembly=CompanyName.ApplicationName.Converters" 
... 
<UserControl.Resources> 
  <Converters:DebugConverter x:Key="Debug" /> 
</UserControl.Resources> 
... 
<ListBox ItemsSource="{Binding Items, Converter={StaticResource Debug}}" />

However, this method can be unsafe to use in a production environment and the converter should be removed when debugging is finished. If it is left connected in release code, an exception will be thrown at runtime, complaining that Windows has encountered a user-defined breakpoint. Although I wouldn't recommend leaving a converter that is just used for debugging data bound values connected in a production environment, we can make a slight alteration to it to completely eliminate the danger of this occurring:

[ValueConversion(typeof(object), typeof(object))] 
public class DebugConverter : IValueConverter 
{ 
  public object Convert(object value, Type targetType, object parameter,
CultureInfo culture) { Break(value); return value; } public object ConvertBack(object value, Type targetType,
object parameter, CultureInfo culture) { Break(value); return value; }

[Conditional("DEBUG")]
private void Break(object value)
{
Debugger.Break();
}
}

Now, the Debugger.Break method and the data bound value have been moved into a separate Break method, where the value of the value input parameter can be inspected. Note the use of the ConditionalAttribute attribute on this new method. It provides a way to include or exclude methods that it has been set on, depending on the current solution configuration. If the configuration is set to debug, this method can be called, but otherwise, all calls to it are removed from the compiled code. In this way, we can be assured that we will not run into problems with our release code.

Summary

In this chapter, we've investigated the best ways to track down our coding problems. We've looked at the various debug tracing outputs that we have access to and even discovered how to output our own custom trace information. We discovered that the exceptions that are thrown in WPF often hide their useful information in their InnerException properties. Finally, we found out a number of tips and tricks to use when trying to find errors with our data bound values.

The next chapter delves deeply into the subject of application frameworks and we get started on constructing our own. We find out about the benefit of base classes and discover alternative ways to implement our framework functionality. The chapter will finish off by investigating a variety of techniques to ensure that our applications maintain the essential Separation of Concerns that MVVM provides.

Left arrow icon Right arrow icon
Download code icon Download Code

Key benefits

  • Discover a smarter way of working with WPF using the MVVM software architectural pattern
  • Create your own lightweight application framework to build your future applications upon
  • Understand data binding and learn how to use it in an application

Description

Microsoft Windows Presentation Foundation (WPF) provides a rich set of libraries and APIs for developers to create engaging user experiences. This book features a wide range of examples, from simple to complex, to demonstrate how to develop enterprise-grade applications with WPF. This updated second edition of Mastering Windows Presentation Foundation starts by introducing the benefits of using the Model-View-View Model (MVVM) software architectural pattern with WPF, then moves on, to explain how best to debug our WPF applications. It explores application architecture, and we learn how to build the foundation layer of our applications. It then demonstrates data binding in detail, and examines the various built-in WPF controls and a variety of ways in which we can customize them to suit our requirements. We then investigate how to create custom controls, for when the built-in functionality in WPF cannot be adapted for our needs. The latter half of the book deals with polishing our applications, using practical animations, stunning visuals and responsive data validation. It then moves on, to look at improving application performance, and ends with tutorials on several methods of deploying our applications.

Who is this book for?

This Windows book is for developers with basic to intermediate-level knowledge of Windows Presentation Foundation and for those interested in simply enhancing their WPF skills. If you're looking to learn more about application architecture and designing user interfaces in a visually appealing manner, you'll find this book useful.

What you will learn

  • Discover MVVM and how it helps development with WPF
  • Implement your own custom application framework
  • Data bind the correct way
  • First understand, then adapt the built-in controls
  • Master practical animations
  • Implement responsive data validation
  • Create visually appealing user interfaces
  • Improve application performance

Product Details

Country selected
Publication date, Length, Edition, Language, ISBN-13
Publication date : Mar 30, 2020
Length: 626 pages
Edition : 2nd
Language : English
ISBN-13 : 9781838640040
Category :
Languages :

What do you get with eBook?

Product feature icon Instant access to your Digital eBook purchase
Product feature icon Download this book in EPUB and PDF formats
Product feature icon Access this title in our online reader with advanced features
Product feature icon DRM FREE - Read whenever, wherever and however you want
Product feature icon AI Assistant (beta) to help accelerate your learning
OR
Modal Close icon
Payment Processing...
tick Completed

Billing Address

Product Details

Publication date : Mar 30, 2020
Length: 626 pages
Edition : 2nd
Language : English
ISBN-13 : 9781838640040
Category :
Languages :

Packt Subscriptions

See our plans and pricing
Modal Close icon
$19.99 billed monthly
Feature tick icon Unlimited access to Packt's library of 7,000+ practical books and videos
Feature tick icon Constantly refreshed with 50+ new titles a month
Feature tick icon Exclusive Early access to books as they're written
Feature tick icon Solve problems while you work with advanced search and reference features
Feature tick icon Offline reading on the mobile app
Feature tick icon Simple pricing, no contract
$199.99 billed annually
Feature tick icon Unlimited access to Packt's library of 7,000+ practical books and videos
Feature tick icon Constantly refreshed with 50+ new titles a month
Feature tick icon Exclusive Early access to books as they're written
Feature tick icon Solve problems while you work with advanced search and reference features
Feature tick icon Offline reading on the mobile app
Feature tick icon Choose a DRM-free eBook or Video every month to keep
Feature tick icon PLUS own as many other DRM-free eBooks or Videos as you like for just ₱260 each
Feature tick icon Exclusive print discounts
$279.99 billed in 18 months
Feature tick icon Unlimited access to Packt's library of 7,000+ practical books and videos
Feature tick icon Constantly refreshed with 50+ new titles a month
Feature tick icon Exclusive Early access to books as they're written
Feature tick icon Solve problems while you work with advanced search and reference features
Feature tick icon Offline reading on the mobile app
Feature tick icon Choose a DRM-free eBook or Video every month to keep
Feature tick icon PLUS own as many other DRM-free eBooks or Videos as you like for just ₱260 each
Feature tick icon Exclusive print discounts

Frequently bought together


Stars icon
Total 9,696.97
Mastering Windows Presentation Foundation
₱2806.99
C# 9 and .NET 5 – Modern Cross-Platform Development
₱4235.99
Clean Code in C#
₱2653.99
Total 9,696.97 Stars icon
Banner background image

Table of Contents

14 Chapters
A Smarter Way of Working with WPF Chevron down icon Chevron up icon
Debugging WPF Applications Chevron down icon Chevron up icon
Writing Custom Application Frameworks Chevron down icon Chevron up icon
Becoming Proficient with Data Binding Chevron down icon Chevron up icon
Using the Right Controls for the Job Chevron down icon Chevron up icon
Adapting the Built-In Controls Chevron down icon Chevron up icon
Mastering Practical Animations Chevron down icon Chevron up icon
Creating Visually Appealing User Interfaces Chevron down icon Chevron up icon
Implementing Responsive Data Validation Chevron down icon Chevron up icon
Completing that Great User Experience Chevron down icon Chevron up icon
Improving Application Performance Chevron down icon Chevron up icon
Deploying Your Masterpiece Application Chevron down icon Chevron up icon
What Next? Chevron down icon Chevron up icon
Other Books You May Enjoy Chevron down icon Chevron up icon

Customer reviews

Top Reviews
Rating distribution
Full star icon Full star icon Half star icon Empty star icon Empty star icon 2.8
(9 Ratings)
5 star 22.2%
4 star 11.1%
3 star 11.1%
2 star 33.3%
1 star 22.2%
Filter icon Filter
Top Reviews

Filter reviews by


Evert Wiesenekker May 13, 2020
Full star icon Full star icon Full star icon Full star icon Full star icon 5
What I like about this book it builds everything ground-up, like a Command wrapper, Dependency Injection ect. Great if you want to learn something more than just use some NuGet package.
Amazon Verified review Amazon
前田 Jul 24, 2021
Full star icon Full star icon Full star icon Full star icon Full star icon 5
WPFは、.NET Framework のような手続き型のライブラリーではなく、大枠の処理がフレームワークで実行されるように設計されています。したがって、プログラムは宣言型の構造になります。そのために、フレームワークの構造がどうなっているかを知らなくては、効率的で、効果的なプログラムは構築できません。この本は、WPFの構造を説明しており、どのようにプログラムするのが効率的かを解説しています。ある程度のWPFのプログラム経験のある人が対象になるのでしょう。 これから、WPFを習得しようとする場合は、最初に入門書を呼んだほうがわかりやすいいと思います。経験者にとっても有益な本です。GITHUBからサンプルプログラムが入手できるのですが、本文との対応表がないのでサンプルを開発環境で見ながら、本文を読みたいという場合に苦労するでしょう。残念。
Amazon Verified review Amazon
Amazon Customer May 09, 2020
Full star icon Full star icon Full star icon Full star icon Empty star icon 4
I found this book is very much insightful and I learned a lot of new fundamental technique in WPF programming. Especially, I like author's approach to emphasizing architectural thing, such as MVVM, data binding and controls content presentation models etc. It's not a good book for WPF beginners but I think it's very good book for intermediate programmers who want to improve WPF coding skill.Though the second edition is supposed to be updated to VisualStudio 2019, it seems it doesn't cover much about new C# language features nor .NET core 3.1 specific things. Also This books build its own application framework from scratch, but it might be better to cover some popular frameworks for MVVM , DI, logging and localization etc. that are essential for real world application development.
Amazon Verified review Amazon
k0ntrol Dec 23, 2020
Full star icon Full star icon Full star icon Empty star icon Empty star icon 3
Very insightful book, but often hard to follow as a beginner.
Amazon Verified review Amazon
Timothy D. Gray Jan 25, 2024
Full star icon Full star icon Empty star icon Empty star icon Empty star icon 2
Honestly skip this book. I bought it directly from Packt and wish I didnt. it wastes a ton on talking about code management and frameworks. There are significantly better books on the subject to read about this subject. so 1/3rd right off the bat you skip. then another chunk on data binding which again there are way better books on the subject out there. I had to get almost 1/2 way through before it even started to talk about WPF and how to get started. All the other stuff is just there to pad the book to make you feel like you got some value. The rest is all what you can glean easily and presented in a much better way from several websites and in a far FAR more updated and accurate way. This book is already massively out of date at 4 years old now. If you can find it on sale for $5 it may be worth it, but at the full price it is absolutely a waste of your money. You will come out of this book more confused than when you started. The parts on custom layouts are useful. so it gets a star for that. but you can get more from digging through the github code to see things that are not explained at all in the book. like why the heck does my menu bar go moving around when the form is resized? common WPF problems and solutions are not covered at all in this "mastering" book.
Amazon Verified review Amazon
Get free access to Packt library with over 7500+ books and video courses for 7 days!
Start Free Trial

FAQs

How do I buy and download an eBook? Chevron down icon Chevron up icon

Where there is an eBook version of a title available, you can buy it from the book details for that title. Add either the standalone eBook or the eBook and print book bundle to your shopping cart. Your eBook will show in your cart as a product on its own. After completing checkout and payment in the normal way, you will receive your receipt on the screen containing a link to a personalised PDF download file. This link will remain active for 30 days. You can download backup copies of the file by logging in to your account at any time.

If you already have Adobe reader installed, then clicking on the link will download and open the PDF file directly. If you don't, then save the PDF file on your machine and download the Reader to view it.

Please Note: Packt eBooks are non-returnable and non-refundable.

Packt eBook and Licensing When you buy an eBook from Packt Publishing, completing your purchase means you accept the terms of our licence agreement. Please read the full text of the agreement. In it we have tried to balance the need for the ebook to be usable for you the reader with our needs to protect the rights of us as Publishers and of our authors. In summary, the agreement says:

  • You may make copies of your eBook for your own use onto any machine
  • You may not pass copies of the eBook on to anyone else
How can I make a purchase on your website? Chevron down icon Chevron up icon

If you want to purchase a video course, eBook or Bundle (Print+eBook) please follow below steps:

  1. Register on our website using your email address and the password.
  2. Search for the title by name or ISBN using the search option.
  3. Select the title you want to purchase.
  4. Choose the format you wish to purchase the title in; if you order the Print Book, you get a free eBook copy of the same title. 
  5. Proceed with the checkout process (payment to be made using Credit Card, Debit Cart, or PayPal)
Where can I access support around an eBook? Chevron down icon Chevron up icon
  • If you experience a problem with using or installing Adobe Reader, the contact Adobe directly.
  • To view the errata for the book, see www.packtpub.com/support and view the pages for the title you have.
  • To view your account details or to download a new copy of the book go to www.packtpub.com/account
  • To contact us directly if a problem is not resolved, use www.packtpub.com/contact-us
What eBook formats do Packt support? Chevron down icon Chevron up icon

Our eBooks are currently available in a variety of formats such as PDF and ePubs. In the future, this may well change with trends and development in technology, but please note that our PDFs are not Adobe eBook Reader format, which has greater restrictions on security.

You will need to use Adobe Reader v9 or later in order to read Packt's PDF eBooks.

What are the benefits of eBooks? Chevron down icon Chevron up icon
  • You can get the information you need immediately
  • You can easily take them with you on a laptop
  • You can download them an unlimited number of times
  • You can print them out
  • They are copy-paste enabled
  • They are searchable
  • There is no password protection
  • They are lower price than print
  • They save resources and space
What is an eBook? Chevron down icon Chevron up icon

Packt eBooks are a complete electronic version of the print edition, available in PDF and ePub formats. Every piece of content down to the page numbering is the same. Because we save the costs of printing and shipping the book to you, we are able to offer eBooks at a lower cost than print editions.

When you have purchased an eBook, simply login to your account and click on the link in Your Download Area. We recommend you saving the file to your hard drive before opening it.

For optimal viewing of our eBooks, we recommend you download and install the free Adobe Reader version 9.