First, we will take a look at what we can do with supervised machine learning. With the following Terminal prompt, we will launch a new Jupyter Notebook:
jupyter notebook
Once we are inside this top-level, Hands-on-Supervised-Machine-Learning-with-Python-master home directory, we will go directly inside the examples directory:

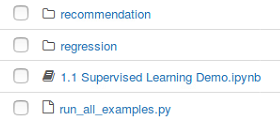
You can see that our only Notebook in here is 1.1 Supervised Learning Demo.ipynb:

We have the supervised learning demo Jupyter Notebook. We are going to be using a UCI dataset called the Spam dataset. This is a list of different emails that contain different features that correspond to spam or not spam. We want to build a machine learning algorithm that can predict whether or not we have an email coming in that is going to be spam. This could be extremely helpful for you if you're running your own email server.
So, the first function in the following code is simply a request's get function. You should already have the dataset, which is already sitting inside the examples directory. But in case you don't, you can go ahead and run the following code. You can see that we already have spam.csv, so we're not going to download it:
from urllib.request import urlretrieve, ProxyHandler, build_opener, install_opener
import requests
import os
pfx = "https://archive.ics.uci.edu/ml/machine-learning databases/spambase/"
data_dir = "data"
# We might need to set a proxy handler...
try:
    proxies = {"http": os.environ['http_proxy'],
               "https": os.environ['https_proxy']}
    print("Found proxy settings")
    #create the proxy object, assign it to a variable
    proxy = ProxyHandler(proxies)
    # construct a new opener using your proxy settings
    opener = build_opener(proxy)
    # install the opener on the module-level
    install_opener(opener)

except KeyError:
    pass
# The following will download the data if you don't already have it...
def get_data(link, where):
    # Append the prefix
    link = pfx + link
Next, we will use the pandas library. This is a data analysis library from Python. You can install it when we go through the next stage, which is the environment setup. This library is a data frame data structure that is a kind of native Python, which we will use as follows:
import pandas as pd
names = ["word_freq_make", "word_freq_address", "word_freq_all",
         "word_freq_3d", "word_freq_our", "word_freq_over",
         "word_freq_remove", "word_freq_internet", "word_freq_order",
         "word_freq_mail", "word_freq_receive", "word_freq_will",
         "word_freq_people", "word_freq_report", "word_freq_addresses",
         "word_freq_free", "word_freq_business", "word_freq_email",
         "word_freq_you", "word_freq_credit", "word_freq_your",
         "word_freq_font", "word_freq_000", "word_freq_money",
         "word_freq_hp", "word_freq_hpl", "word_freq_george",
         "word_freq_650", "word_freq_lab", "word_freq_labs",
         "word_freq_telnet", "word_freq_857", "word_freq_data",
         "word_freq_415", "word_freq_85", "word_freq_technology",
         "word_freq_1999", "word_freq_parts", "word_freq_pm",
         "word_freq_direct", "word_freq_cs", "word_freq_meeting",
         "word_freq_original", "word_freq_project", "word_freq_re",
         "word_freq_edu", "word_freq_table", "word_freq_conference",
         "char_freq_;", "char_freq_(", "char_freq_[", "char_freq_!",
         "char_freq_$", "char_freq_#", "capital_run_length_average",
         "capital_run_length_longest", "capital_run_length_total",
         "is_spam"]
df = pd.read_csv(os.path.join("data", "spam.csv"), header=None, names=names)
# pop off the target
y = df.pop("is_spam")
df.head()
This allows us to lay out our data in the following format. We can use all sorts of different statistical functions that are nice to use when you're doing machine learning:

If some of this terminology is not familiar to you, don't panic yet—we will learn about these terminologies in detail over the course of the book.
For train_test_split, we will take the df dataset and split it into two parts: train set and test set. In addition to that, we have the target, which is a 01 variable that indicates true or false for spam or not spam. We will split that as well, which includes the corresponding vector of true or false labels. By splitting the labels, we get 3680 training samples and 921 test samples, file as shown in the following code snippet:
from sklearn.model_selection import train_test_split
X_train, X_test, y_train, y_test = train_test_split(df, y, test_size=0.2, random_state=42, stratify=y)
print("Num training samples: %i" % X_train.shape[0])
print("Num test samples: %i" % X_test.shape[0])
The output of the preceding code is as follows:
Num training samples: 3680
Num test samples: 921
In the following code, we have the packtml library. This is the actual package that we are building, which is a classification and regression tree classifier. CARTClassifier is simply a generalization of a decision tree for both regression and classification purposes. Everything we fit here is going to be a supervised machine learning algorithm that we build from scratch. This is one of the classifiers that we are going to build in this book. We also have this utility function for plotting a learning curve. This is going to take our train set and break it into different folds for cross-validation. We will fit the training set in different stages of numbers of training samples, so we can see how the learning curve converges between the train and validation folds, which determines how our algorithm is learning, essentially:
from packtml.utils.plotting import plot_learning_curve
from packtml.decision_tree import CARTClassifier
from sklearn.metrics import accuracy_score
import numpy as np
import matplotlib.pyplot as plt
%matplotlib inline

# very basic decision tree
plot_learning_curve(
        CARTClassifier, metric=accuracy_score,
        X=X_train, y=y_train, n_folds=3, seed=21, trace=True,
        train_sizes=(np.linspace(.25, .75, 4) * X_train.shape[0]).astype(int),
        max_depth=8, random_state=42)\
    .show()
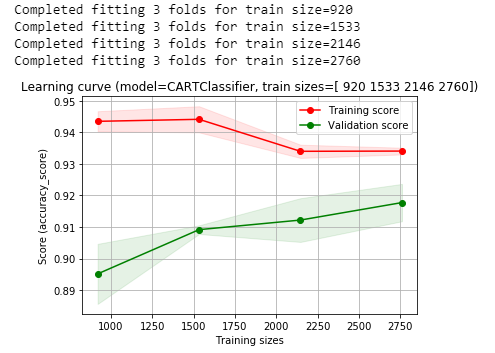
We will go ahead and run the preceding code and plot how the algorithm has learned across the different sizes of our training set. You can see we're going to fit it for 4 different training set sizes at 3 folds of cross-validation.
So, what we're actually doing is fitting 12 separate models, which will take a few seconds to run:

In the preceding output, we can see our Training score and our Validation score. The Training score diminishes as it learns to generalize, and our Validation score increases as it learns to generalize from the training set to the validation set. So, our accuracy is hovering right around 92-93% on our validation set.
We will use the hyperparameters from the very best one here:
decision_tree = CARTClassifier(X_train, y_train, random_state=42, max_depth=8)


