Here, we're going to look at QlikView selections, QlikView architecture, and how we can answer a business question with the help of a QlikView dashboard. So, let's go ahead and learn a little bit about QlikView selections with the help of a QlikView demo dashboard.
Important terminologies in QlikView
QlikView selections
Generally, in QlikView, selections are also referred to as filters. Let's explore selections by going to QlikView and opening up the Movies Database file. Let's move to the Dashboard tab to see the selections in action:
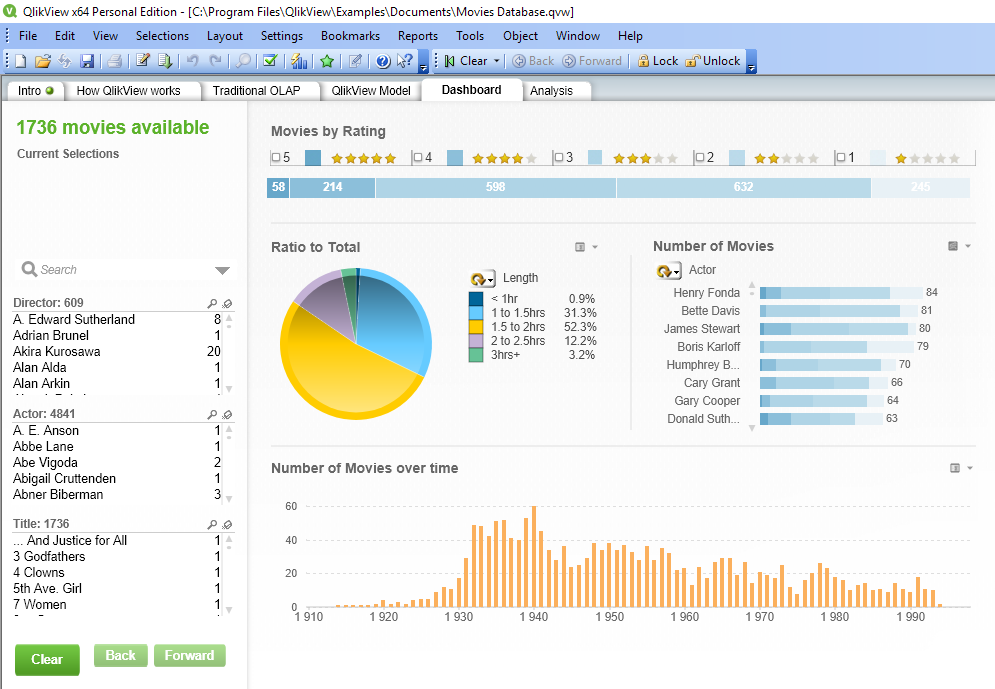
Here, we have different types of selections available, such as Director, Actor, and Title.
These can be referred to as a selection, filters, or a list box, which will be covered later. But, for now, let's go ahead and use selections as the terminology.
The selections we mentioned previously are all different types of text selections that I have at my disposal. At the top, I have some numeric selections as well, such as Movies by Rating. This has five selections for five stars, and I can select any rating between 1 to 5, and see the Dashboard view refreshed for me. For example, let's select a movie rating of 5 to see which movies have five star ratings, which gives us the following output:
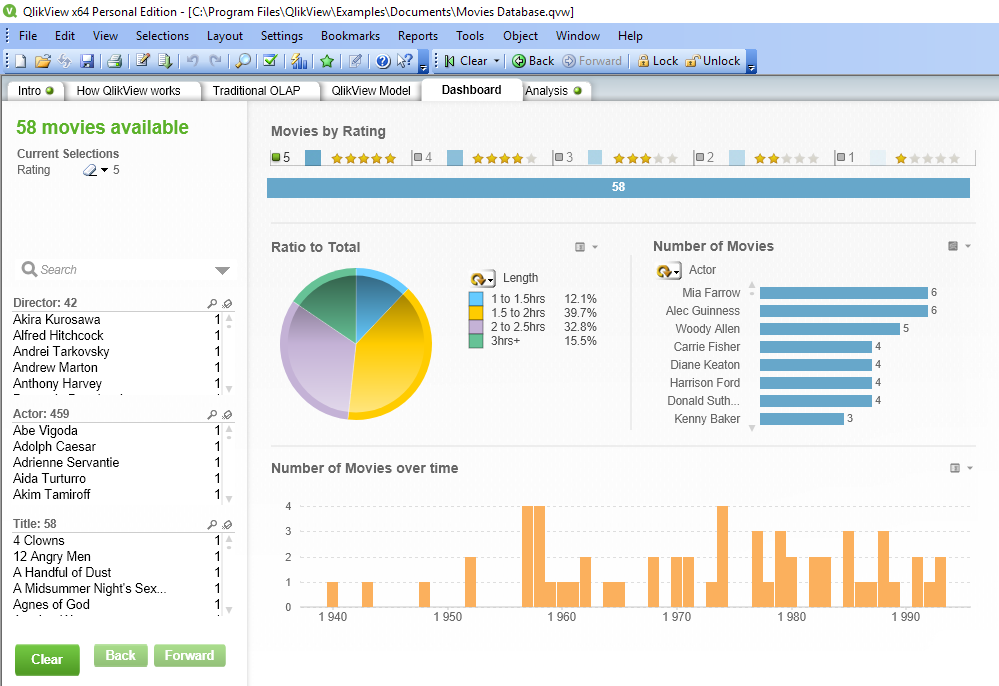
The dashboard is now filtered with the movies that got a five-star rating. With this, we understand that within QlikView, numeric filters are generally given at the top, and textual filters are generally given on the left-hand side. The placement of filters or the selections is not a mandatory requirement, it's just that, over a period of time, that's how QlikView developers have been accustomed to using the numeric and textual filters, and it has automatically become standard.
The next thing about the selections that I want you to observe in the numeric filters in the preceding screenshot, is that only 5 has been highlighted as green. It is an important rule related to the selections in QlikView, where all the values that are grayed out are not related to the selection.
Also, in the textual filters, you will see that there are a lot of values that have been grayed out. This means that all those directors have never created any movie that have been rated as a five. On the other hand, there are a few directors, such as Steven Spielberg and Woody Allen, who have a lot of five-star rated movies. For example, Woody Allen has eight different movies with five-star ratings.
So, if I am really interested in seeing which movies those are, I can click on Woody Allen to filter them. So, let's go ahead and select Woody Allen. This gives us the following screenshot:
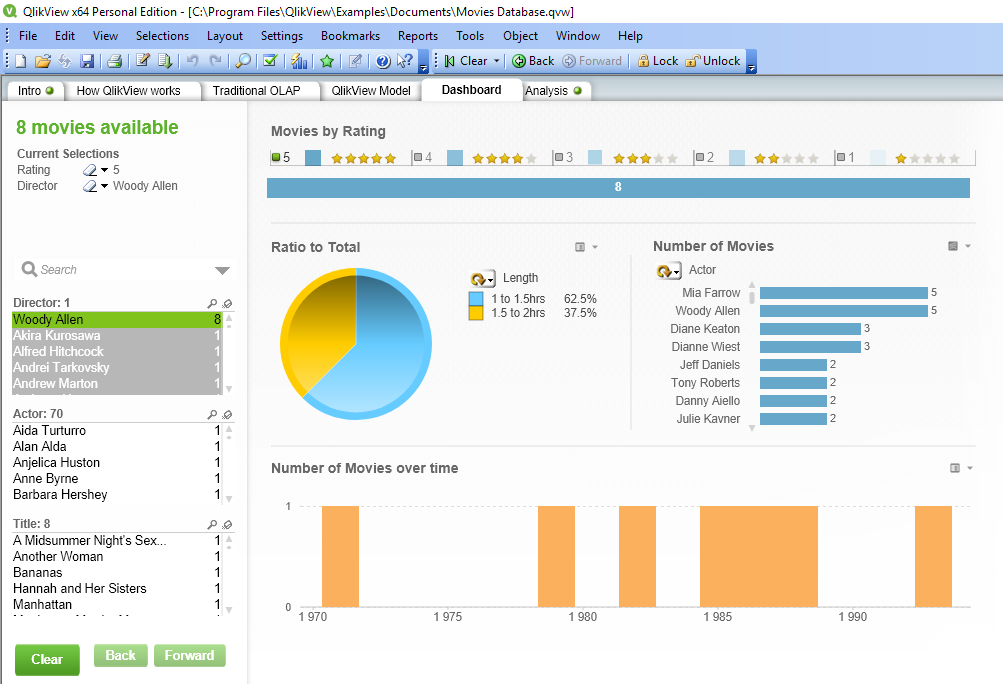
We can see eight movies in the textual filters, such as A Midsummer Night's..., Another Woman, Bananas, Hannah and Her Sisters, and many more. So, now we have an idea about the different types of selections that you have.
QlikView architecture
Now, let's look at the QlikView architecture using the following diagram:
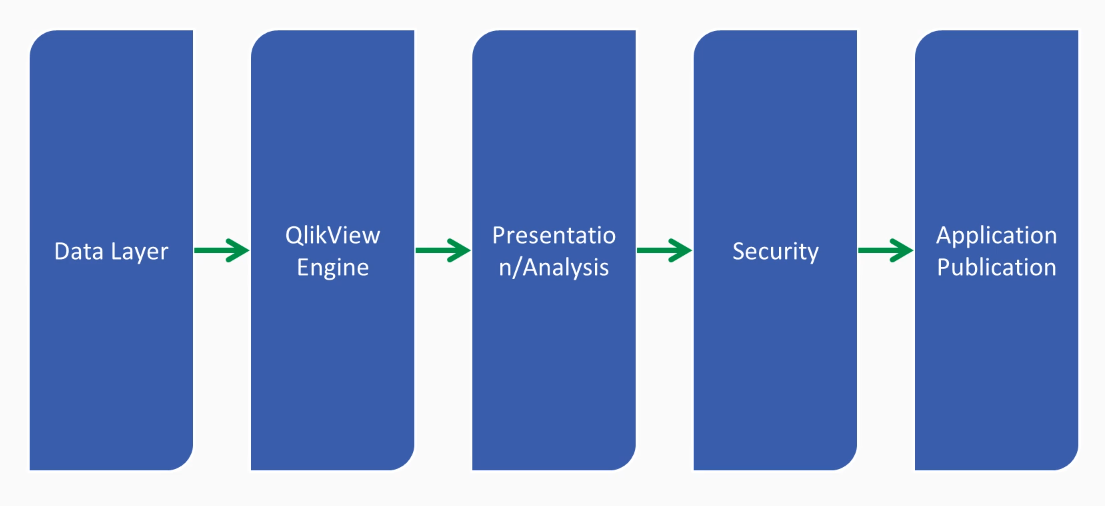
In the QlikView architecture, the very first layer is the Data Layer. You bring the data from the external resources; for example, from an Excel file, from a database, or from the web. Once you get the data into the data layer from various sources, your data gets loaded with the help of the reload option into the QlikView Engine. The QlikView Engine is responsible for creating all the joints and queries by default, using its patented in-memory logic. What that means, is that QlikView creates the logic within the table, so you don't really have to write any SQL query, but, with the help of selections, you're generating the SQL query on the fly within the QlikView system with the help of the QlikView Engine. After that, you have the Presentation/Analysis layer, where you basically create the different types of charts and visualization, as well as filters for the consumption of the end user. After this, you have a Security layer, where you secure the data to make sure that the right information is available to the right user. QlikView has a very flexible security model. After that, the final layer is Application Publication. With the help of the QlikView server, you can publish your application on a QlikView server and distribute it to your end user, and they can view the application within their browser, or mobile, or in a tab, wherever they like. So, there you have it, that's your high-level introduction about QlikView architecture.
Exploring data in QlikView
Now, let's look at the next step, which is answering a business question. So, let's go to the QlikView application we were evaluating for the first section, which was the Movies Database. Here, we have different types of selections, and, if you want to remove these selections, we can click on the Clear button.
Now, if you observe, all the selections have been removed, and we can frame our business question and see, with the help of QlikView, whether we can get an answer. So, let's say I want to see all the movies that are directed by Steven Spielberg.
For that, we'll go to the search box, and start typing Steven. As we type, we can see that the characters we type are available in the Actor, Director, and Title filters. We'll expand the Director filter, and there you will see Steven Spielberg.
We'll click on that, and the dashboard automatically changes to show data related to Steven. In the numeric filters, we can see that Steven has movies that have received ratings from 2 to all the way to 5. Now, let's see which movies have received two-star ratings. We can see the Dashboard for Steven here:
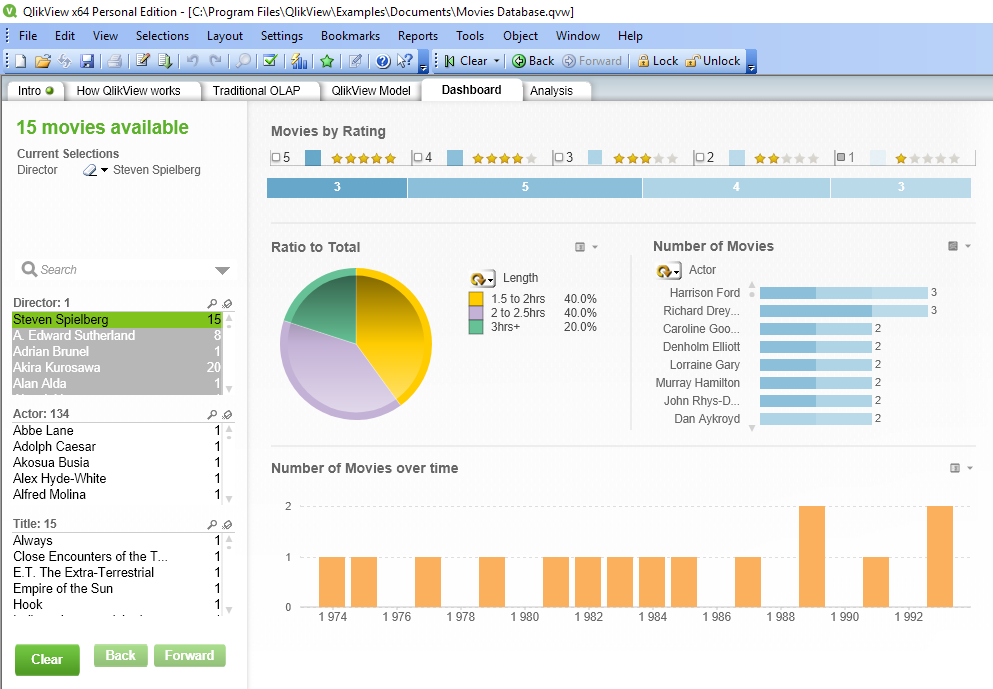
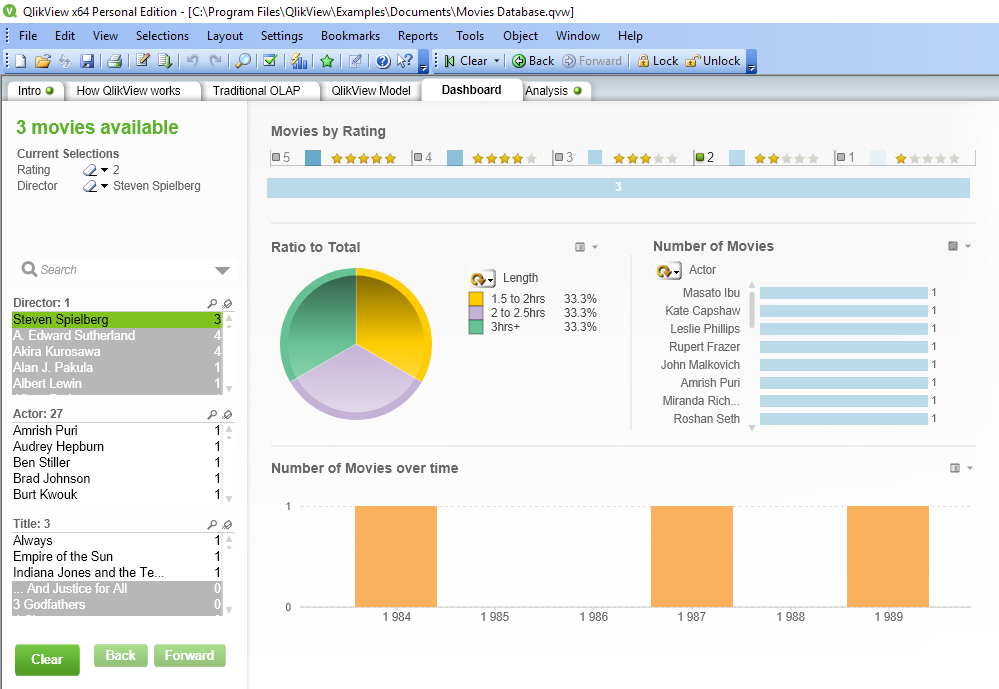
So, we'll click on the 2 numeric filter, and the Dashboard view reveals the three movies that have two-star ratings, namely Always, Empire of the Sun, and Indiana Jones and the Temple of Doom. The following screenshot shows the Dashboard view for the two-star rated movies created by Steven:
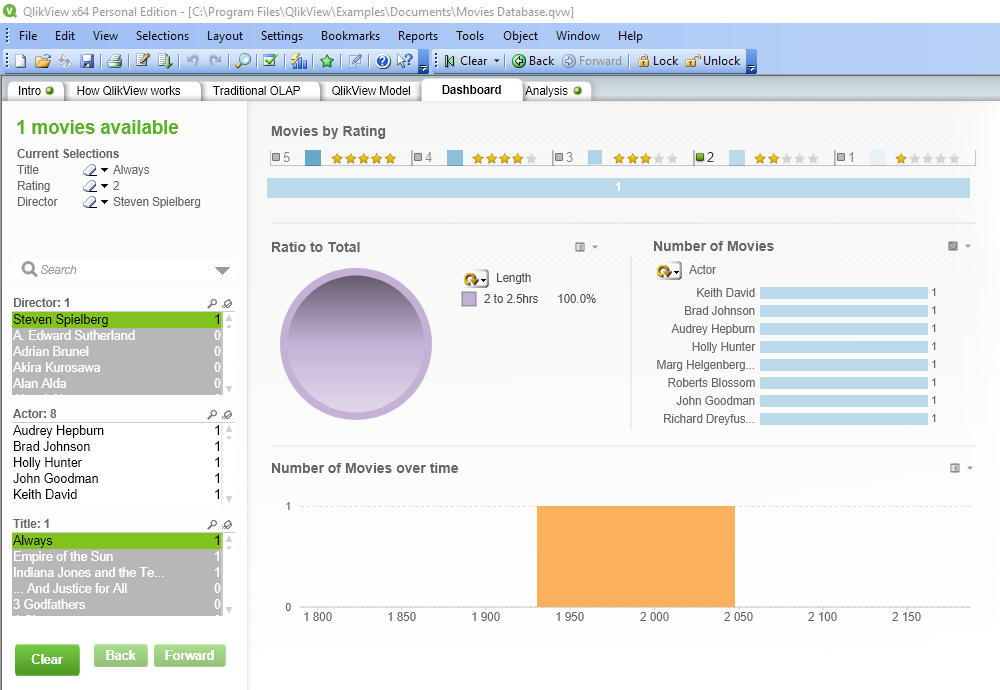
Now, let's look at the details of the movie Always. If I select Always, we'll get all the information about the movie, such as who acted in the movie and its length. The following screenshot shows this:
Now, if we want to remove the selections, there are a couple of ways in which to do so. We can either click on Clear in the toolbar, or we can click on the movie that is currently selected, which is, Always. In the same way, we can clear the Director selection, too.
But, in the Current Selections section, it is indicating that the 2 rating is still selected. We will clear that out by clicking on the 2 numeric filter. Similarly, if I am interested in looking at all the movies that have received three-star ratings, let's say, in the period from 1950 to 1960, I can select the area between 1950 to 1960 in the bar chart with the help of the selection click. This expands the bar chart view to 1950-1960. So, if I have further questions, I can go to Director, Actor, or Title, and get my answer based on the data that I have.
So, here we have looked at QlikView selections, what they are, and what green, gray, and white really mean. We have looked at the QlikView architecture at a very high level, and, finally, we have looked at how we can get our answers with the data, by going to the deepest levels of data that is available to us.


