Training your first ML model using H2O AutoML
All ML pipelines, whether they’re automated or not, eventually follow the same steps that were discussed in the Understanding AutoML and H2O AutoML section in this chapter.
For this implementation, we will be using the Iris flower dataset. This dataset can be found at https://archive.ics.uci.edu/ml/datasets/iris.
Understanding the Iris flower dataset
The Iris flower dataset, also known as Fisher’s Iris dataset, is one of the most popular multivariate datasets – that is, a dataset in which there are two or more variables that are analyzed per observation during model training. The dataset consists of 50 samples of three different varieties of the Iris flower. The features in the dataset include the length and width of the petals and sepals in centimeters. The dataset is often used for studying various classification techniques in ML because of its simplicity. The classification is performed by using the length and width of the petals and sepals as features that determine the class of the Iris flower.
The following screenshot shows a small sample of the dataset:
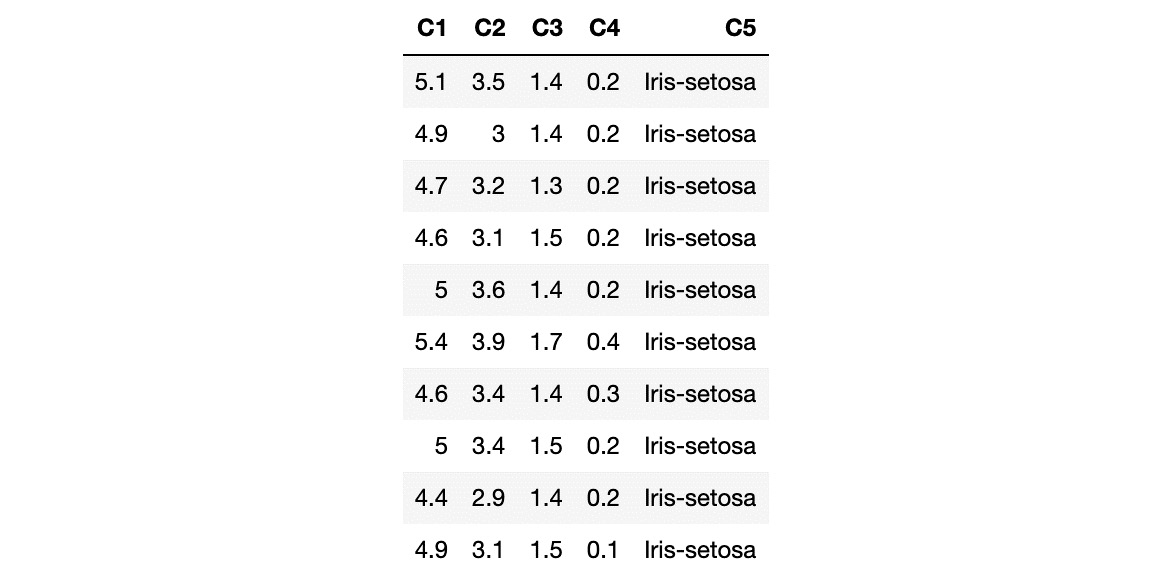
Figure 1.3 – Iris dataset
The columns in the dataset represent the following:
- C1: Sepal length in cm
- C2: Sepal width in cm
- C3: Petal length in cm
- C4: Petal width in cm
- C5: Class:
- Iris-setosa
- Iris-versicolour
- Iris-virginica
In this scenario, C1, C2, C3, and C4 represent the features that are used to determine C5, the class of the Iris flower.
Now that you understand the contents of the dataset that we are going to be working with, let’s implement our model training code.
Model training
Model training is the process of finding the best combination of biases and weights for a given ML algorithm so that it minimizes a loss function. A loss function is a way of measuring how far the predicted value is from the actual value. So, minimizing it indicates that the model is getting closer to making accurate predictions – in other words, it’s learning. The ML algorithm builds a mathematical representation of the relationship between the various features in the dataset and the target label. Then, we use this mathematical representation to predict the potential value of the target label for certain feature values. The accuracy of the predicted values depends a lot on the quality of the dataset, as well as the combination of weights and biases against features used during model training. However, all of this is entirely automated by AutoML and, as such, is not a concern for us.
With that in mind, let’s learn how to quickly and easily create an ML model using H2O in Python.
Model training and prediction in Python
The H2O Python module makes it easy to use H2O in a Python program. The inbuilt functions in the H2O Python module are straightforward to use and hide away a lot of the complexities of using H2O.
Follow these steps to train your very first model in Python using H2O AutoML:
- Import the H2O module:
import h2o
- Initialize H2O to spin up a local H2O server:
h2o.init()
The h2o.init() command starts up or reuses an H2O server instance running locally on port 54321.
- Now, you can import the dataset by using the
h2o.import_file()command while passing the location of the dataset into your system. - Next, import the dataset by passing the location where you downloaded the dataset:
data = h2o.import_file("Dataset/iris.data") - Now, you need to identify which columns of the DataFrame are the features and which are the labels. A label is something that we want to predict, while features are attributes of the label that help identify the label. We train models on these features and then predict the value of the label, given a specific set of feature values. Referring to the dataset in the Understanding the Iris flower dataset section, let’s set all the column names –
C1,C2,C3,C4, andC5– as a list of features:features = data.columns
- Based on our DataFrame, the
C5column, which denotes the class of the Iris flower, is the column that we want to eventually predict once the model has been trained. Hence, we denoteC5as the label and remove it from the remaining set of column names, which we will note as features. Set the target label and remove it from the list of features:label = "C5" features.remove(label)
- Split the DataFrame into training and testing DataFrames:
train_dataframe, test_dataframe = data.split_frame([0.8])
The data.split_frame([0.8]) command splits the DataFrame into two – a training DataFrame and another for testing. The training DataFrame contains 80% of the data, while the testing DataFrame contains the remaining 20%. We will use the training DataFrame to train the model and the testing DataFrame to run predictions on the model once it has been trained to test how the model performs.
Tip
If you are curious as to how H2O splits the dataset based on ratios and how it randomizes the data between different splits, feel free to explore and experiment with the split_frame function. You can find more details at https://docs.h2o.ai/h2o/latest-stable/h2o-py/docs/_modules/h2o/frame.html#H2OFrame.split_frame.
- Initialize the H2O AutoML object. Here, we have set the
max_modelparameter to10to limit the number of models that will be trained by H2O, set AutoML to10, and set the randomseedgenerator to1:aml=h2o.automl.H2OAutoML(max_models=10, seed = 1)
- Now, trigger the AutoML training by passing in the feature columns – that is
C1,C2,C3, andC4– in (x), the label columnC5in (y), and thetrain_dataframeDataFrame using theaml.train()command. This is when H2O starts its automated model training. - Train the model using the H2O AutoML object:
aml.train(x = features, y = label, training_frame = train_dataframe)
During the training, H2O will analyze the type of the label column. For numerical labels, H2O treats the ML problem as a regression problem. If the label is categorical, then it treats the problem as a classification problem. For the Iris flower dataset, the C5 column is a categorical value containing class values. H2O will analyze this column and correctly identify that it is a classification problem and train classification models.
H2O AutoML trains several models behind the scenes using different types of ML algorithms. All the models that have been trained are evaluated on the test dataset and their performance is measured. H2O also provides detailed information about all the models, which users can use to further experiment on the data or compare different ML algorithms and understand which ones are more suitable to solve their ML problem. H2O can end up training 20-30 models, which can take a while. However, since we have passed the max_models parameter as 10, we are limiting the number of models that will be trained so that we can see the output of the training process quickly. More on ensemble learning will be discussed in Chapter 5, Understanding AutoML Algorithms.
- Once the training has finished, AutoML creates a Leaderboard of all the models it has trained, ranking them from the best performing to the worst. This ranking is achieved by comparing all the models’ error metrics. Error metrics are values that measure how many errors the model makes when making predictions on a sample test dataset with the actual label values. Lower error metrics indicate that the model makes fewer errors during prediction, which indicates that it is a better model compared to one with a higher error metric. Extract the AutoML Leaderboard:
model_leaderboard = aml.leaderboard
- Display the AutoML Leaderboard:
model_leaderboard.head(rows=model_leaderboard.nrows)
The Leaderboard will look as follows:
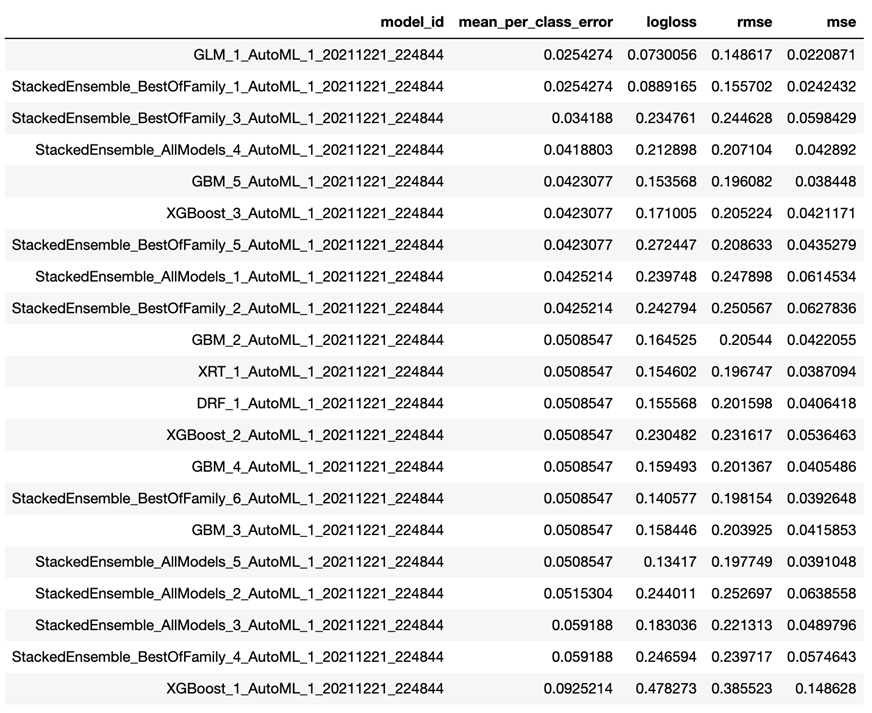
Figure 1.4 – H2O AutoML Leaderboard (Python)
The Leaderboard includes the following details:
model_id: This represents the ID of the model.mean_per_class_error: This metric is used to measure the average of the errors of each class in your multi-class dataset.logloss: This metric is used to measure the negative average of the log of corrected predicted probabilities for each instance.- Root Mean Squared Error (RMSE): This metric is used to measure the standard deviation of prediction errors.
- Mean Squared Error (MSE): This metric is used to measure the average of the squares of the errors.
The Leaderboard sorts the models based on certain default metrics, depending on the type of ML problem, unless specifically mentioned during AutoML training. The Leaderboard sorts the models based on the AUC metric for binary classification, mean_per_class_error for multinomial classification, and deviance for regression.
The metrics are different measures of error in the model’s performance. So, the smaller the error value, the better the model is for making accurate predictions. We will explore the different model performance metrics in Chapter 6, Understanding H2O AutoML Leaderboard and Other Performance Metrics.
In this case, GLM_1_AutoML_1_20211221_224844 is the best model according to H2O AutoML since it is a multinomial classification problem and this model has the lowest mean_per_class_error.
You may notice that despite passing the max_model value as 10, when triggering AutoML for training, we see more than 10 models in the Leaderboard. This is because only 10 models have been trained; the remaining models are Stacked Ensemble models. Stacked Ensemble models are models that are created from what other models have learned and are not technically trained in the normal sense. We will learn more about Stacked Ensemble models in Chapter 5, Understanding AutoML Algorithms, and more about the Leaderboard in Chapter 6, Understanding H2O AutoML Leaderboard and Other Performance Metrics.
Congratulations! You have officially trained your very first ML model using H2O AutoML and it is now ready to be used to make predictions.
Making predictions is very straightforward: we will use the test_dataframe DataFrame that was created from the data.split_frame([0.8]) command.
Execute the following command in Python:
aml.predict(test_dataframe)
That’s it – everything is wrapped inside the predict function of the model object.
After executing the prediction, you will see the following results:
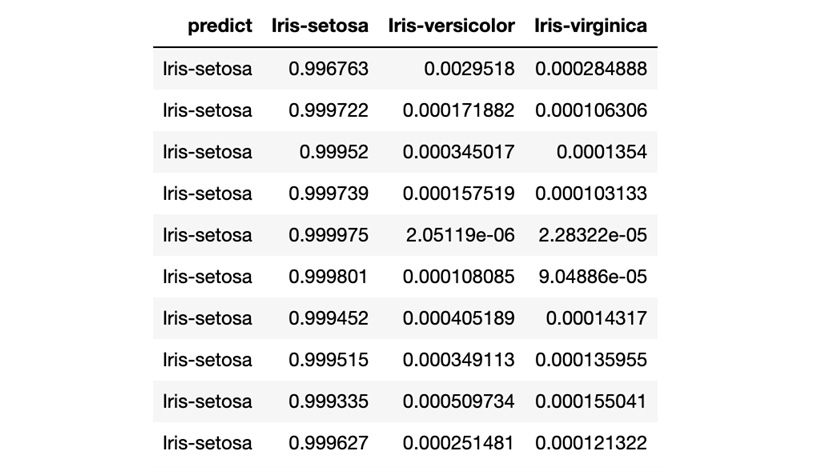
Figure 1.5 – H2O AutoML model prediction (Python)
The prediction result shows a table where every row is a representation of predictions for the rows present in the test DataFrame. The predict column indicates what Iris class it is for that row, while the remaining columns are the calculated probabilities of the Iris classes, as denoted in the column’s name, by the model after reading the feature values of that row. In short, the model predicts that for row 1, there is a 99.6763% chance that it is Iris-setosa.
Congratulations! You have now made an accurate prediction using your newly trained model using AutoML.
Now that we’ve seen how easy it is to use H2O AutoML in Python, let’s learn how to do the same in the R programming language.
Model training and prediction in R
Similar to Python, training and making predictions using H2O AutoML in the R programming language is also very easy. H2O has a lot of support for the R programming language and, as such, has encapsulated much of the sophistication of ML behind ready-to-use functions.
Let’s look at a model training example that uses H2O AutoML in the R programming language on the Iris flower dataset.
You will notice that training models in R is similar to how we do it in Python, with the only difference being the slight change in syntax.
Follow these steps:
- Import the
H2Olibrary:library(h2o)
- Initialize H2O to spin up a local H2O server:
h2o.init()
h2o.init() will start up an H2O server instance that’s running locally on port 54321 and connect to it. If an H2O server already exists on the same port, then it will reuse it.
- Import the dataset using
h2o.importFile(“Dataset/iris.data”)while passing the location of the dataset in your system as a parameter. Import the dataset:data <- h2o.importFile("Dataset/iris.data") - Now, you need to set which columns of the dataframe are the features and which column is the label. Set the
C5column as the target label and the remaining column names as the list of features:label <- "C5" features <- setdiff(names(data), label)
- Split the DataFrame into two parts:
parts <- h2o.splitFrame(data, 0.8)
One DataFrame will be used for training, while the other will be used for testing/validating the model being trained. parts <- h2o.splitFrame(data, 0.8) splits the DataFrame into two parts. One DataFrame contains 80% of the data, while the other contains the remaining 20%. Now, assign the DataFrame that contains 80% of the data as the training DataFrame and the other as the testing or validation DataFrame.
- Assign the first part as the training DataFrame:
train_dataframe <- parts[[1]]
- Assign the second part as the testing DataFrame:
test_dataframe <- parts[[2]]
- Now that the dataset has been imported and its features and labels have been identified, let’s pass them to H2O’s AutoML to train models. This means that you can implement the AutoML model training function in R using
h2o.automl(). Train the model using H2O AutoML:aml <- h2o.automl(x = features, y = label, training_frame = train_dataframe, max_models=10, seed = 1)
- Extract the AutoML Leaderboard:
model_leaderboard <- aml@leaderboard
- Display the AutoML Leaderboard:
print(model_leaderboard, n = nrow(model_leaderboard))
Once the training has finished, AutoML will create a Leaderboard of all the models it has trained, ranking them from the best performing to the worst.
The Leaderboard will display the results as follows:
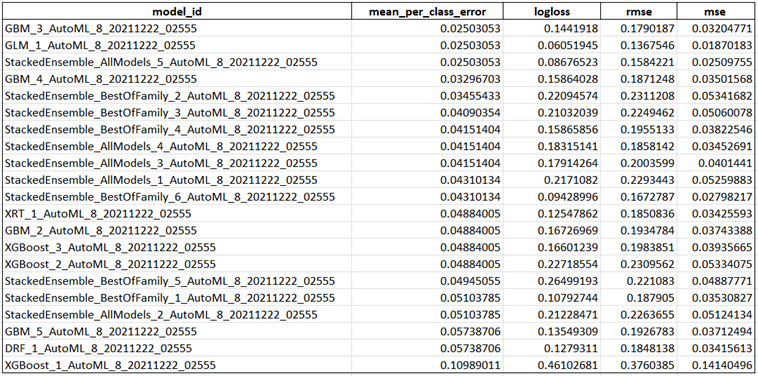
Figure 1.6 – H2O AutoML Leaderboard (R)
The Leaderboard includes the same details as we saw in the Leaderboard we got when training models in Python.
However, you may notice that the best model that’s suggested in this Leaderboard is different from the one we got in our previous experiment.
In this case, GBM_3_AutoML_8_20211222_02555 is the best model according to H2O AutoML, while in the previous experiment, it was GLM_1_AutoML_1_20211221_224844. This may be due to several factors, such as a different random number being generated for the seed value during model training or different data values being split across the training and testing DataFrames between the two experiments. This is what makes ML tricky – every step that you perform in a model training pipeline can greatly affect the overall performance of your trained model. At the end of the day, ML is a best-effort approach to making the most accurate predictions.
Congratulations – you have officially trained your ML model using H2O AutoML in R. Now, let’s learn how to make predictions on it. We will use the testing DataFrame we created after the split function to make predictions on the model we trained.
Execute the following command in R to make predictions:
predictions <- h2o.predict(aml, test_dataframe)
The predict function of the h2o object accepts two parameters. One is the model object, which in our case is the aml object, while the other is the DataFrame to make predictions on. By default, the aml object will use the best model in the Leaderboard to make predictions.
After executing the prediction, you will see the following results:
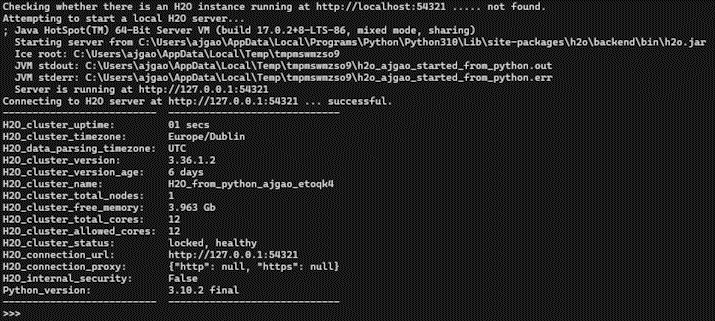
Figure 1.7 – H2O AutoML model prediction (R)
The results show a table with similar details that we saw in our previous experiment with Python. Every row is a representation of predictions for the rows present in the test DataFrame. The predict column indicates what Iris class it is for that row, while the remaining columns are the calculated probabilities of the Iris classes.
Congratulations – you have made an accurate prediction using your newly trained model using AutoML in R. Now, let’s summarize this chapter.


