Monitoring your S3 bucket
Enabling and monitoring S3 metrics allows you to proactively manage your S3 resources, optimize performance, ensure appropriate security and compliance measures are in place, identify cost-saving opportunities, and ensure the operational readiness of your S3 infrastructure. S3 offers various methods for monitoring your buckets, including S3 server access logs, CloudTrail, CloudWatch metrics, and S3 event notifications. S3 server access logs can be enabled to log each request made to the bucket. CloudTrail captures actions taken on S3 or API calls on the bucket, allowing you to monitor and audit actions, including object-level operations such as uploads, downloads, and deletions. CloudWatch metrics track specific metrics for your buckets and allow you to set up alarms so that you receive notifications when certain thresholds are met. S3 event notifications enable you to set up notifications for specific S3 events and configure actions in response to those events. In this recipe, we will cover enabling CloudTrail for your S3 buckets and configuring CloudWatch metrics to monitor high-volume data transfer based on these logs.
Getting ready
To proceed with this recipe, you need to enable CloudTrail so that it can log S3 data events and insights. Follow these steps:
- Open the AWS Management Console (https://console.aws.amazon.com/console/home?nc2=h_ct&src=header-signin) and navigate to the CloudTrail service.
- Click on Trails in the left navigation pane and click on Create trail to create a new trail.
- Provide a name for the trail in the Trail name field.
- For Storage location, you need to provide an S3 bucket for storing CloudTrail logs. You can select Use existing S3 bucket or Create new S3 bucket.
- Optionally, you can enable Log file SSE-KMS encryption and choose the KMS key.
- Under CloudWatch Logs, choose Yes for Send CloudTrail events to CloudWatch Logs.
- Configure the CloudWatch Logs settings as per your requirements. For example, you can select an existing CloudWatch Logs group or create a new one:
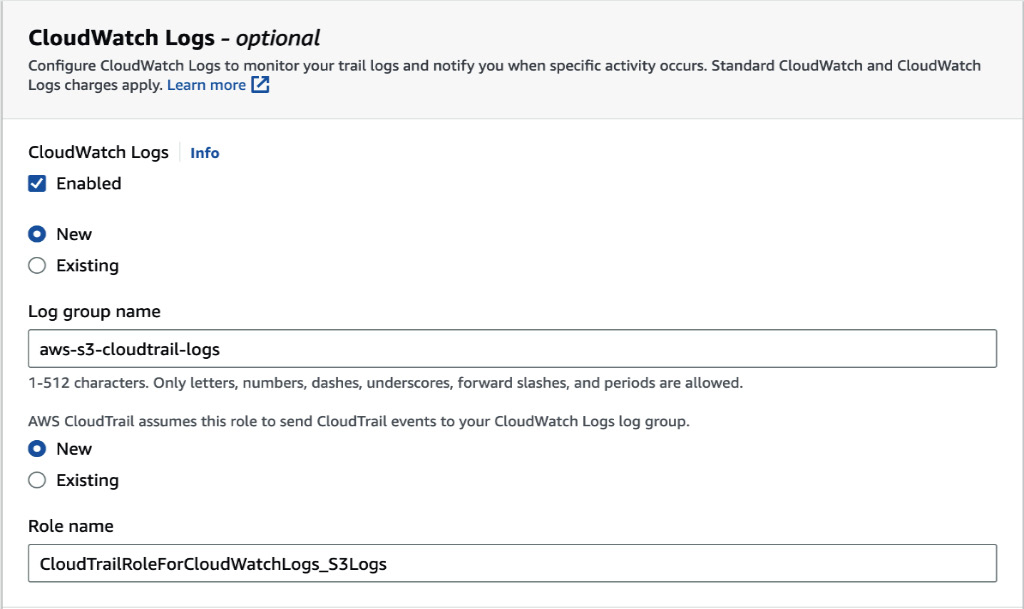
Figure 1.12 – Enabling CloudWatch Logs
- For Role name, choose to create a new one and give it a name.
- Review the other trail settings, such as log file validation and tags, make adjustments if needed, and click on Next.
- Under the Events section, enable Data events and Insight events in addition to Management events, which is already enabled.
- Under Management events, select Read and Write:
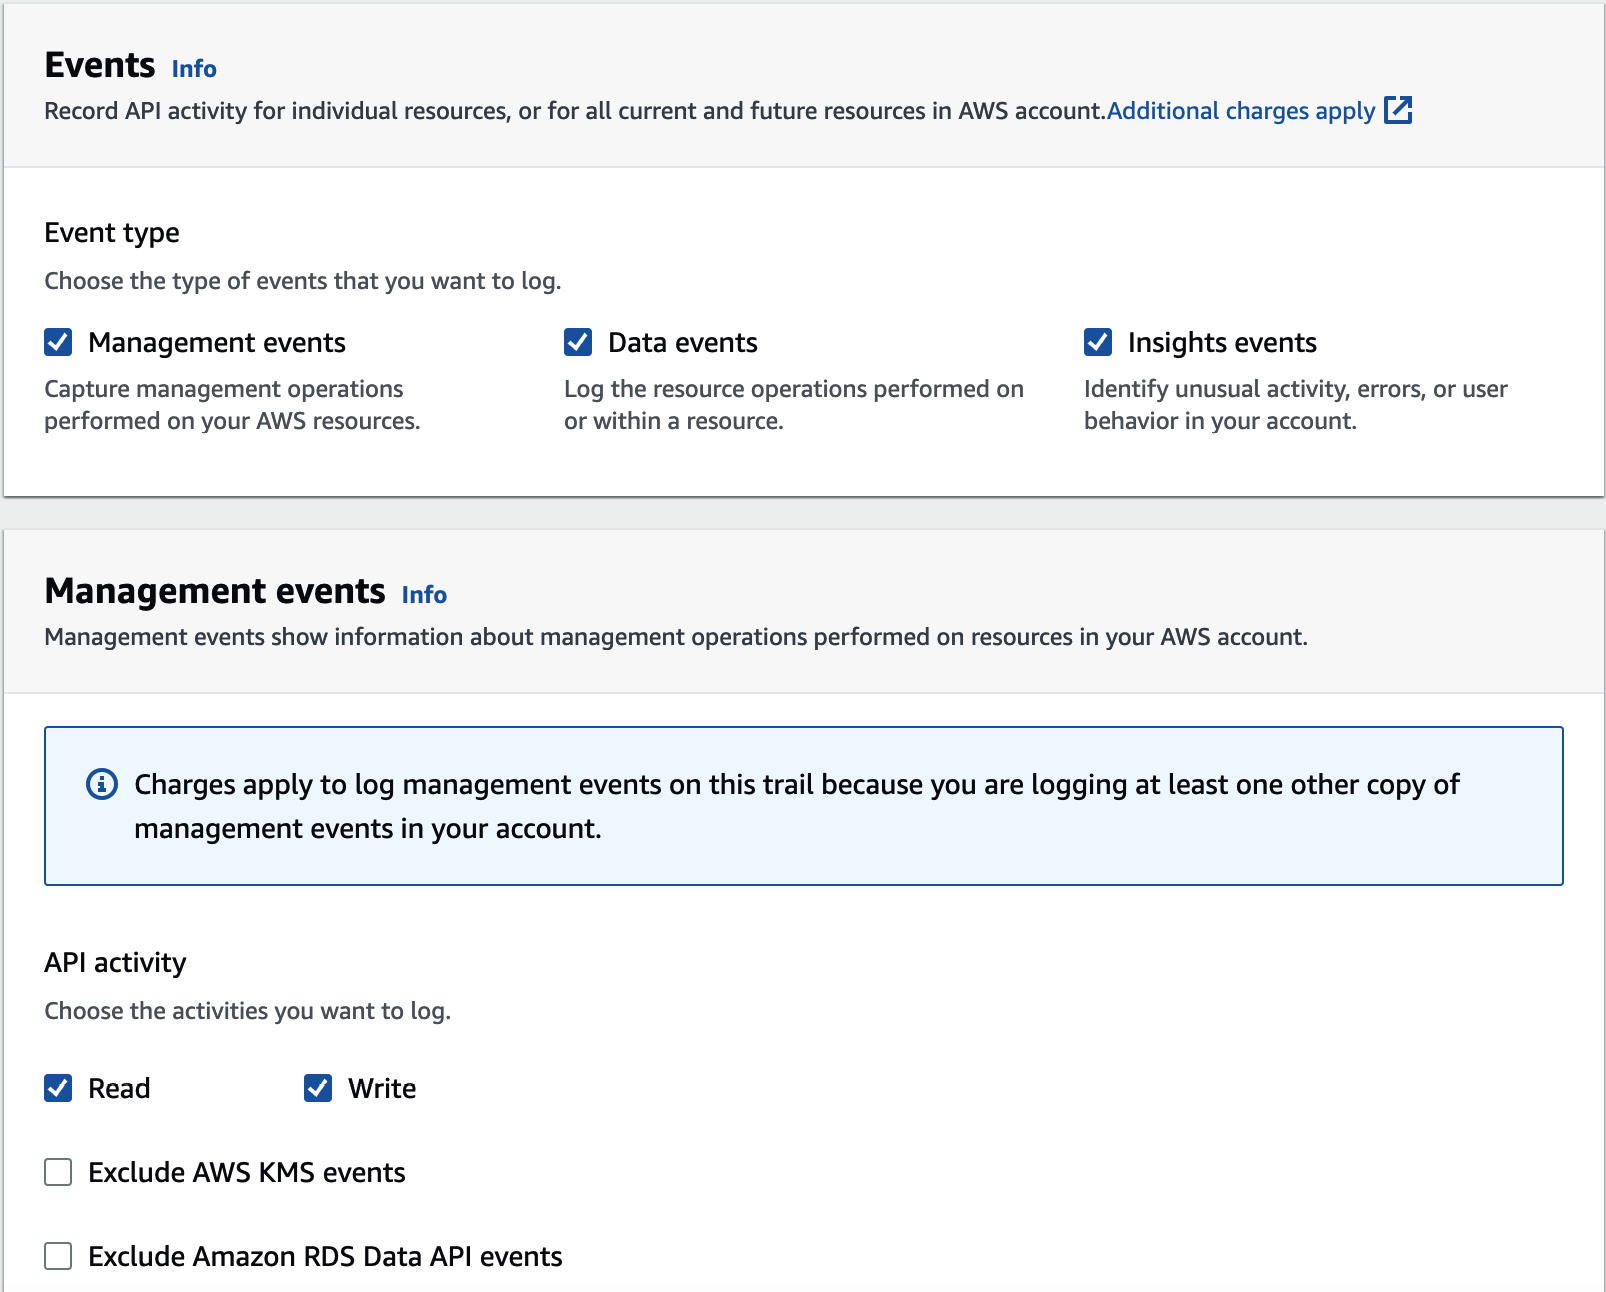
Figure 1.13 – Configuring Events
- Under Data events, choose S3 for Data event type and Log all events for the Log selector template.
- Under Insights events, select API call rate and API error rate.
- Click on Next and then click on Create trail to create the trail.
Once the trail has been created, CloudTrail will start capturing S3 data events and storing the logs in the specified S3 bucket. Simultaneously, the logs will be sent to the CloudWatch Logs group specified during trail creation.
How to do it…
- Open the AWS Management Console (https://console.aws.amazon.com/console/home?nc2=h_ct&src=header-signin) and navigate to the CloudWatch console.
- Go to Log groups from the navigation pane on the left and select the CloudTrail log group you just created.
- Click on Create Metric Filter from the Action drop-down list.
- Provide
{ ($.eventName = CopyObject) || ($.eventName = PutObject) || ($.eventName = CompleteMultipartUpload) && $.request.bytes_transferred > 500000000}as the filter pattern. This filter pattern will capture events related to copying or uploading objects to S3 that are larger than 500 MB. The threshold value should be set based on your bucket access patterns.You can test your pattern by specifying one of the log files or providing a custom log in the Test pattern section. Then, you can click on Test pattern and validate the result:
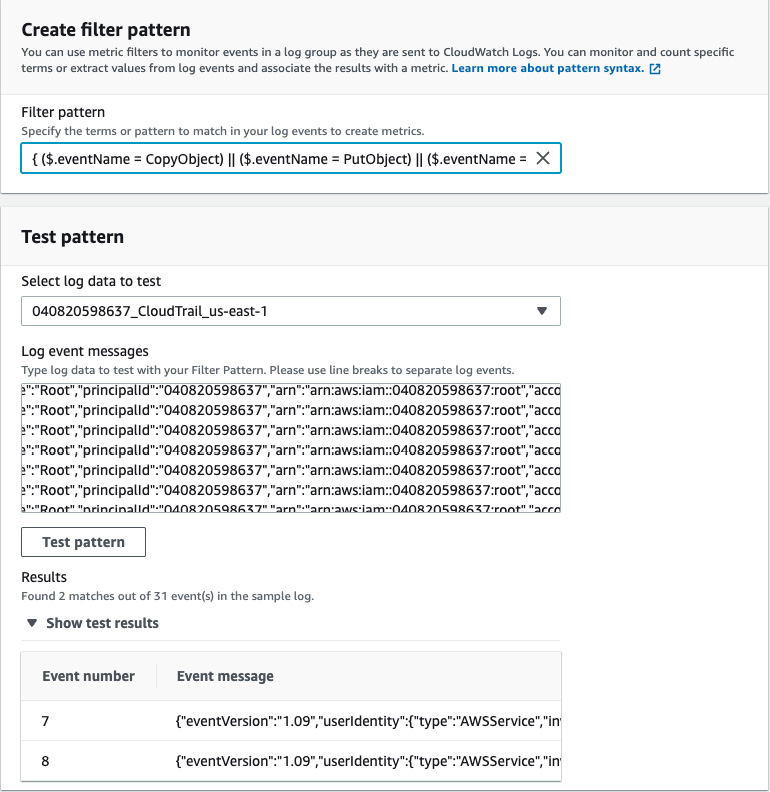
Figure 1.14 – Filter pattern
- Click on Next.
- Under the Create filter name field, specify a filter name.
- Under the Metric Details section, specify a Metric namespace value (for example,
S3Metrics) and provide a name for the metric itself under Metric name (for example,HighVolumeTransfers). - Set Unit to Count for your metric and set Metric value to
1to indicate that a transfer event has occurred. Finally, set Default value to0:
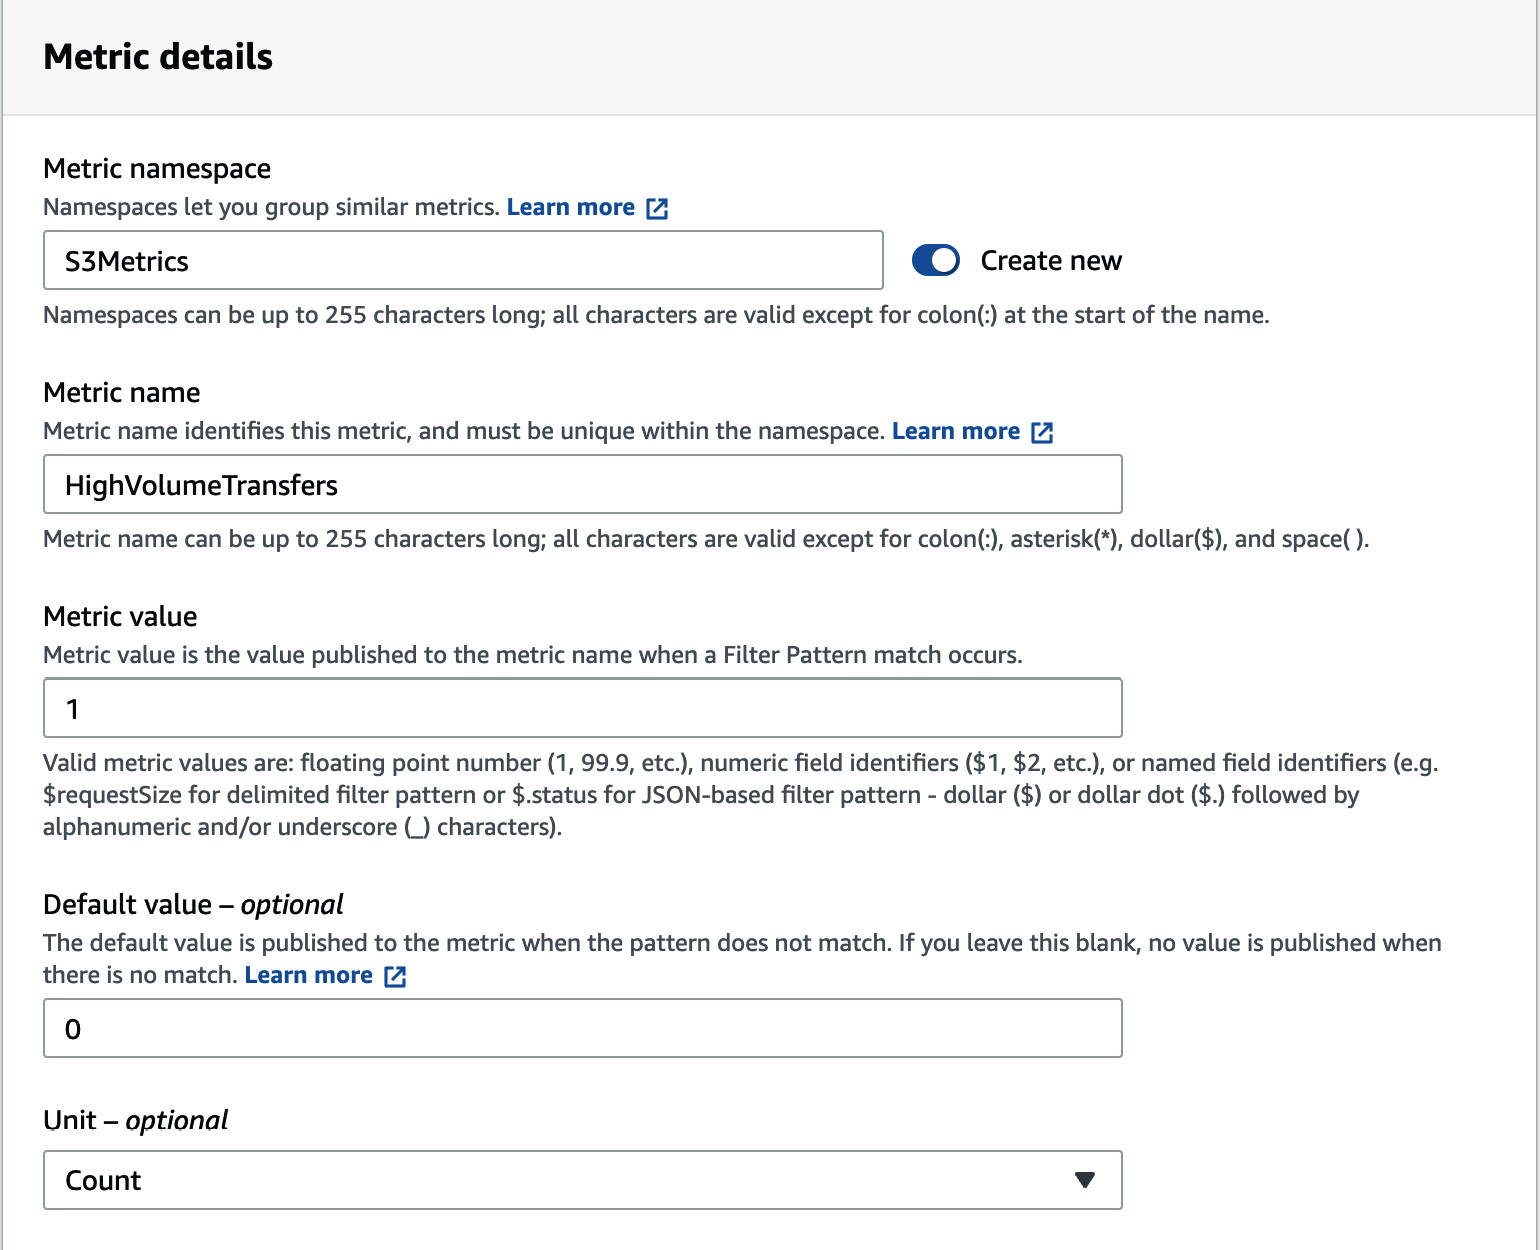
Figure 1.15 – Metric details
- Click on Create metric filter.
How it works…
By enabling CloudTrail in your AWS account and ensuring that the logs are delivered to CloudWatch, the S3 API activities can be accessed and analyzed within your AWS environment. By creating a metric filter with a customized filter pattern that matches S3 transfer events, relevant information from the CloudTrail logs can be extracted. Once the metric filter is created, CloudWatch generates a custom metric based on the filter’s configuration. This metric represents the occurrence of high-volume S3 transfers. You can then view this metric in the CloudWatch console, where you can gain insights into your S3 transfer activity and take the necessary actions.
There’s more…
Once your metric has been created, you can create alarms based on the metric’s value to notify you when a high volume of S3 transfers has been detected.
To create an alarm for the metric you have created based on high-volume S3 transfers from CloudTrail logs on CloudWatch, follow these steps:
- Go to the CloudWatch console and select the Alarms tab.
- Click on Create Alarm. In the Create Alarm wizard, select the metric you created. You can find it by navigating the namespace and finding the metric name you configured earlier.
- Under the Metric section, set Statistic to Sum and Period to 15 minutes. This can be changed as per your needs:
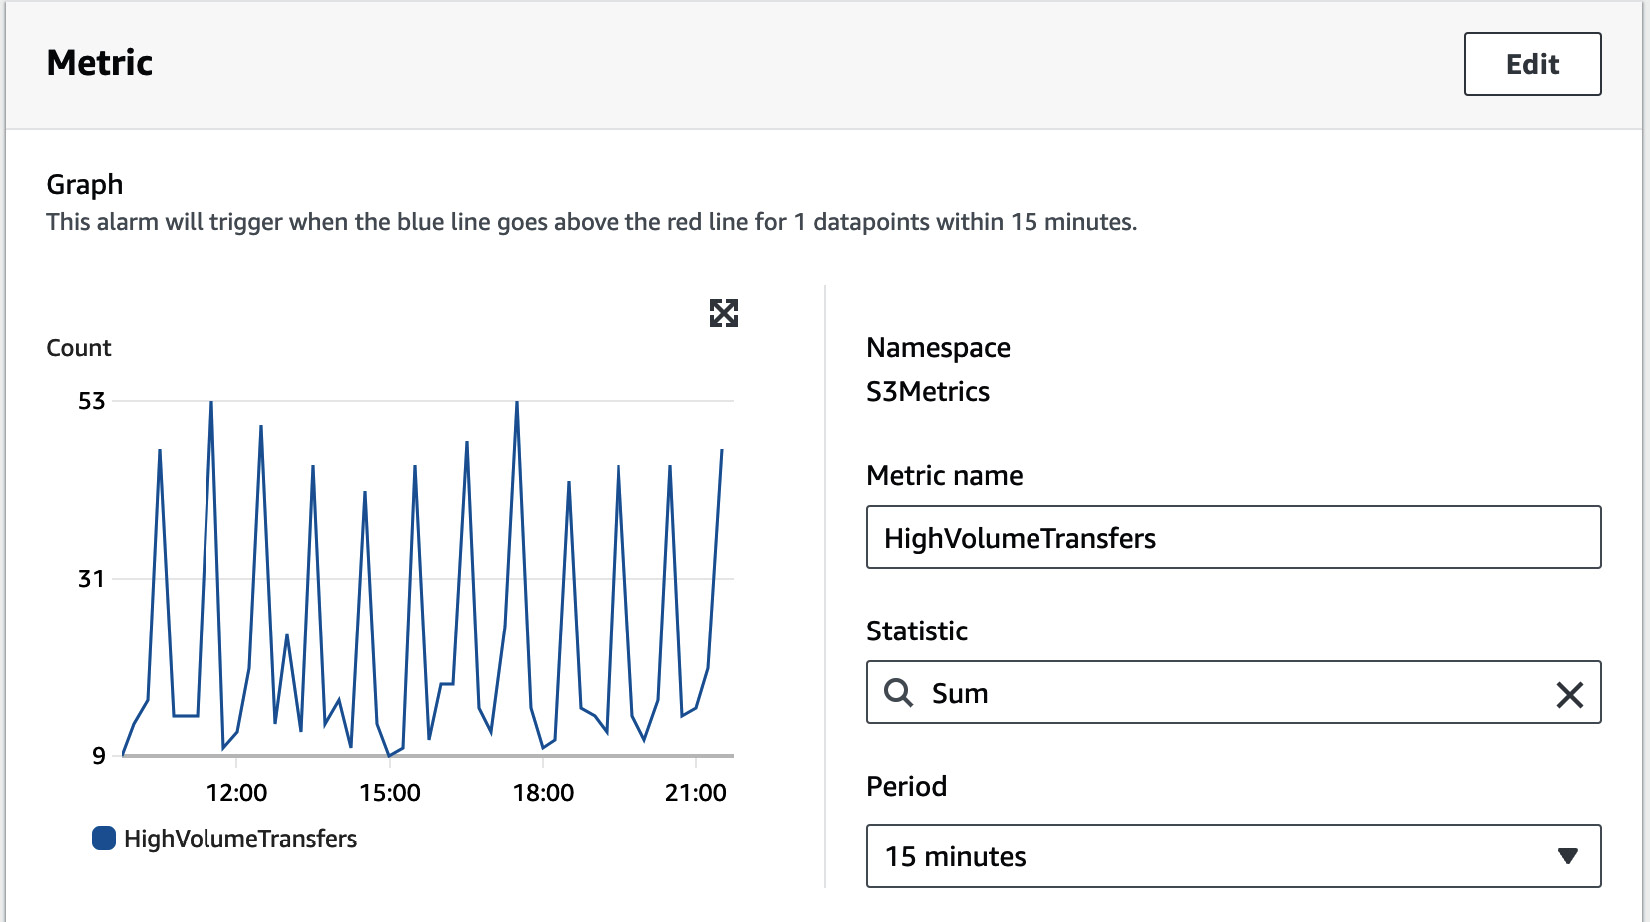
Figure 1.16 – Metric statistics
- Under the Conditions section, Set Threshold type to Static and choose Greater than for the alarm condition. This indicates a high volume transfer on your bucket, as per your observations. Optionally, you can choose how many data points within the evaluation period must be breached to cause the alarm to go to the alarm state by expanding Additional configuration. This will help you avoid false positives caused by transient spikes in the metric values:
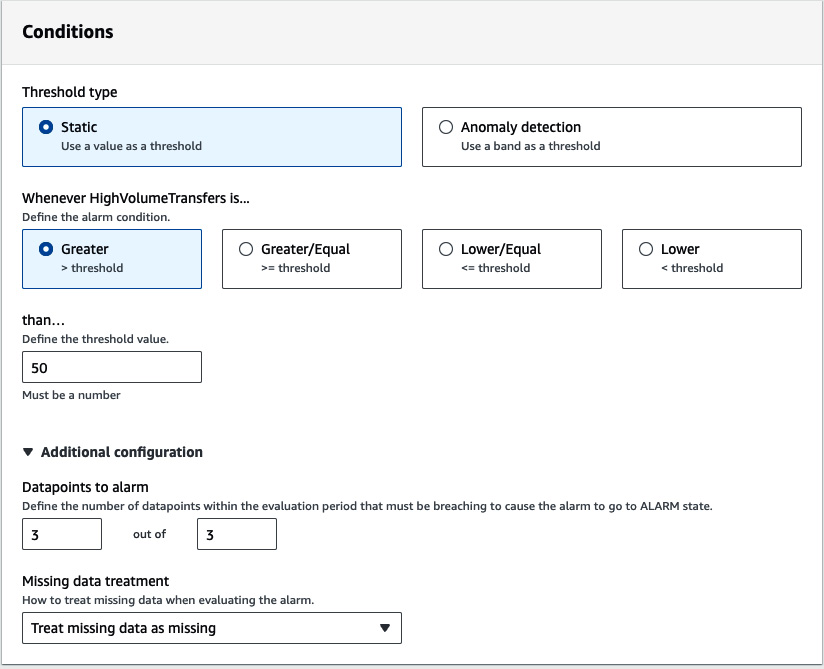
Figure 1.17 – Metric conditions
- Click on Next.
- Under the Notification section, choose In alarm to send a notification when the metric is in the alarm state. Choose Create a new topic, provide a name for it and the email endpoints that will receive the SNS notification, and click on Create topic or choose an existing SNS topic if you have one that’s been configured. You can configure other actions to be executed if the alarm state is triggered, such as executing a Lambda function or performing automated scaling actions:
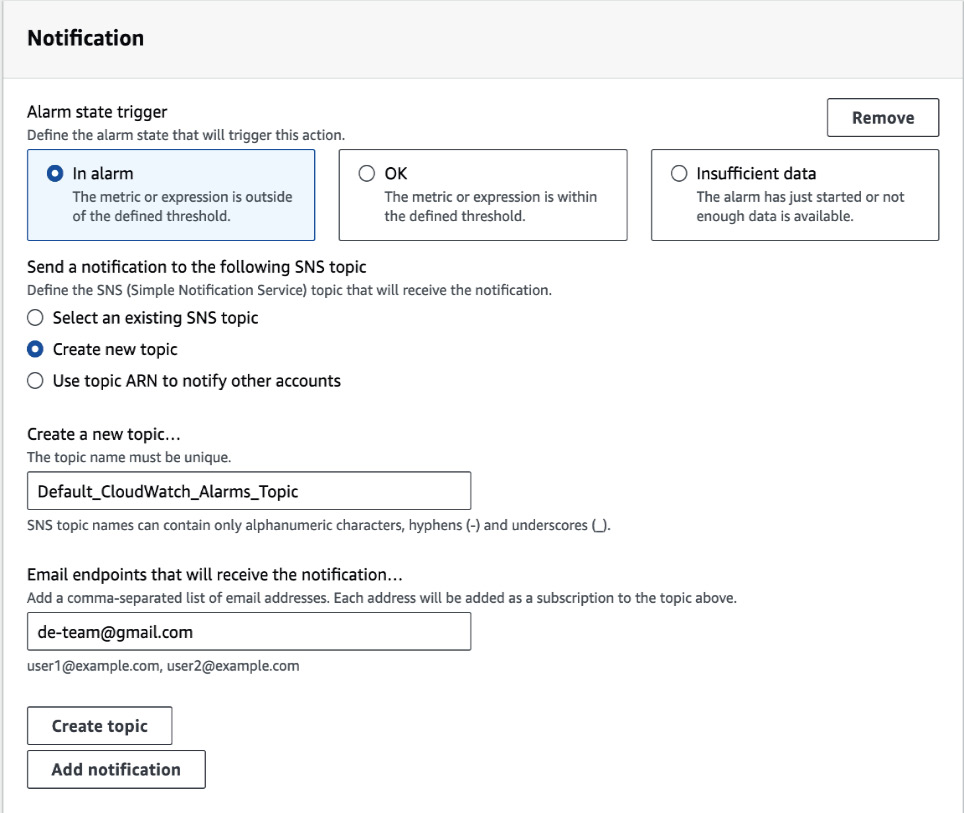
Figure 1.18 – Metric notification settings
- Provide a name for the alarm so that it can be identified with ease.
- Review the alarm settings and click on Create Alarm to create the alarm.
Once the alarm has been created, it will start monitoring the metric for high-volume S3 transfers based on the defined conditions. If the threshold is breached for the specified duration (there are more than 150 data transfer requests of more than 500 MB within 45 minutes), the alarm state will be triggered, and an SNS notification will be sent. This allows you to receive timely notifications and take appropriate remedial actions in case of high-volume S3 transfers, ensuring that any potential issues are addressed proactively.
See also
- S3 monitoring tools: https://docs.aws.amazon.com/AmazonS3/latest/userguide/monitoring-automated-manual.html
- Logging options for S3: https://docs.aws.amazon.com/AmazonS3/latest/userguide/logging-with-S3.html


