Playtesting
The basics of testing in Unity are very straightforward; you press play on the toolbar and play your game to see that it works as intended from the perspective of a gamer. However, there are two tools worth mentioning that will help with this process:
- Inspector debugging
- The game stats panel
Let's look at each of these in more detail.
Enabling Inspector debugging
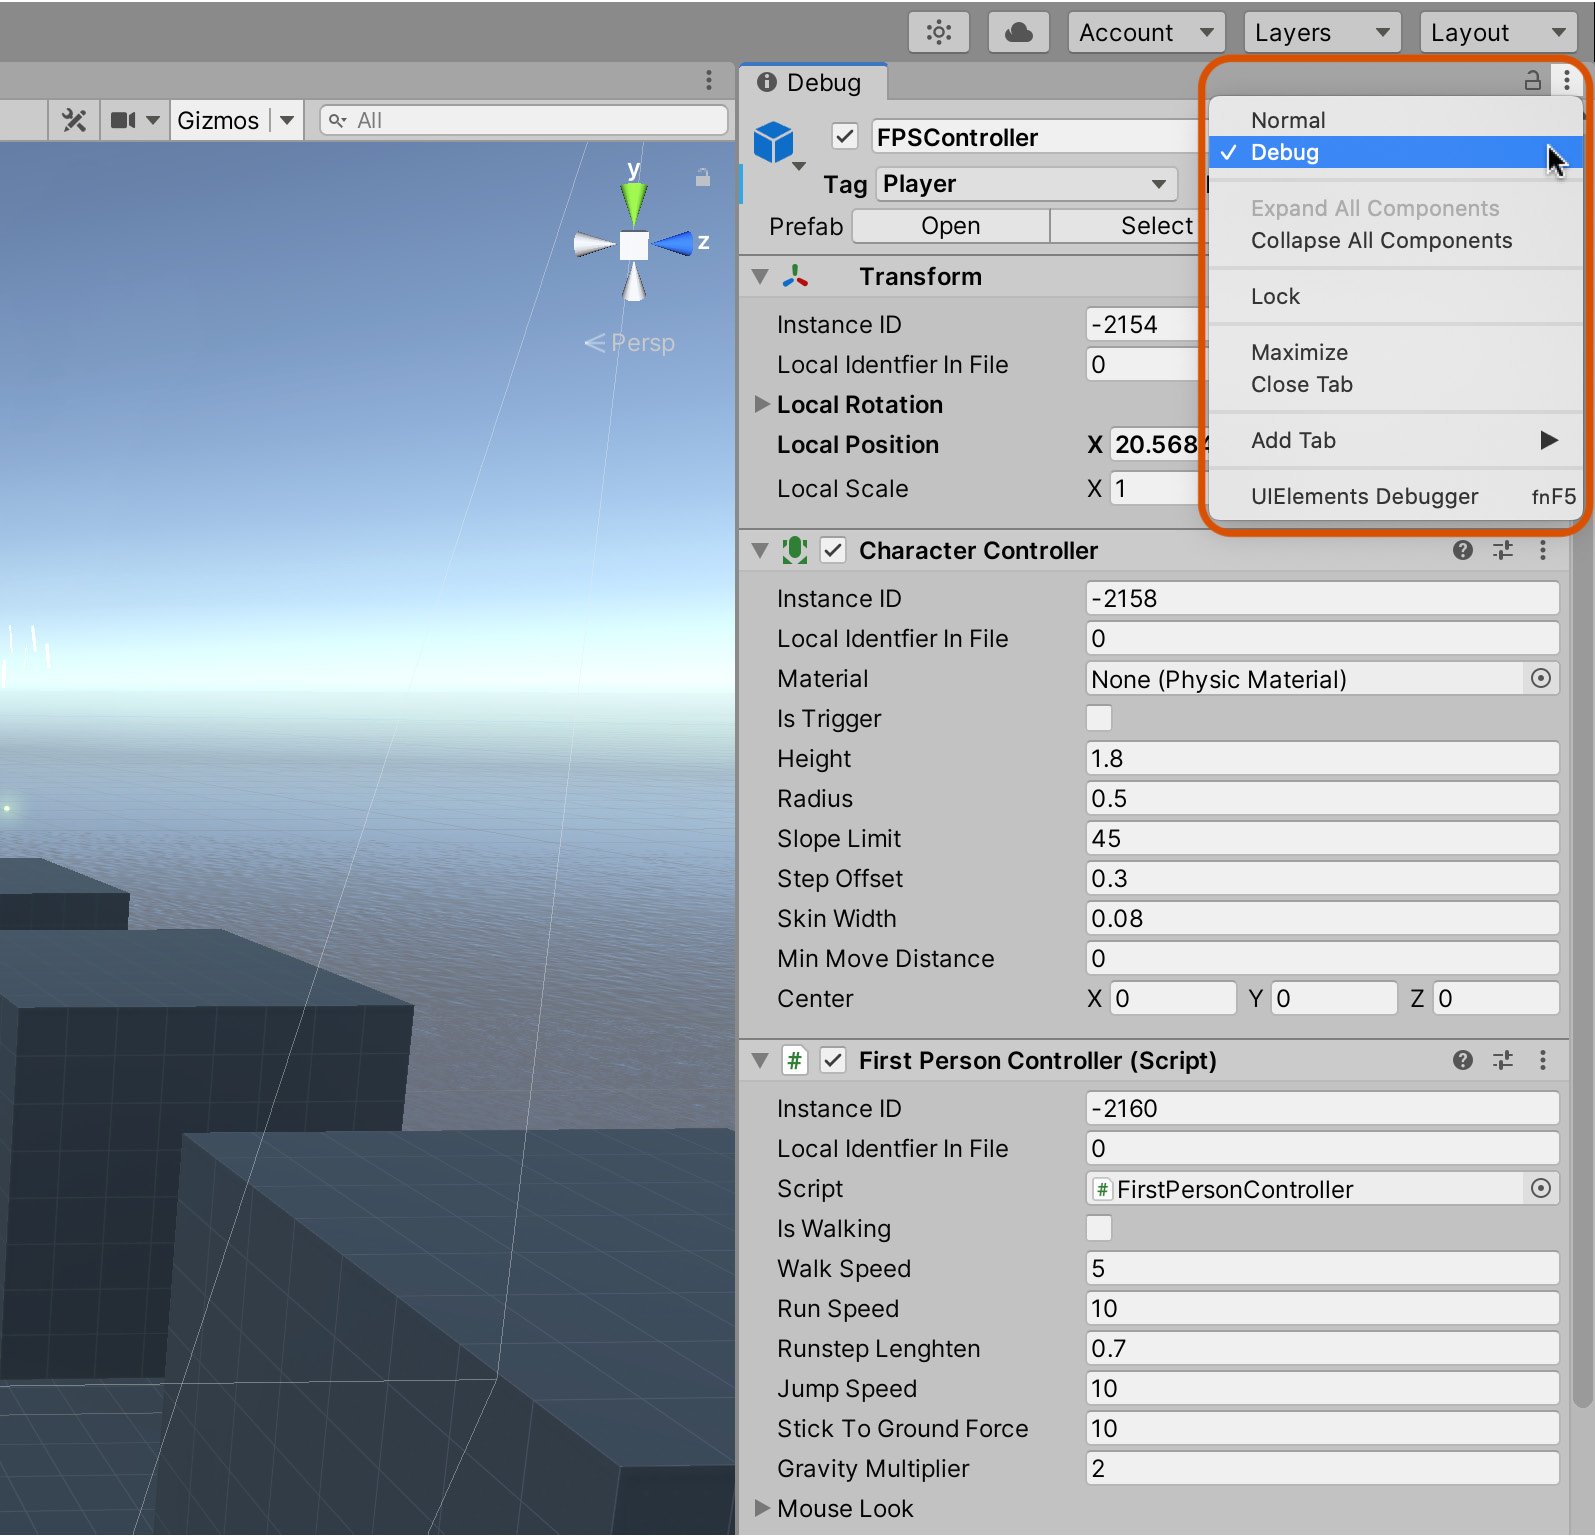
In addition to playing, you can also enable debugging mode from the Inspector to keep a watchful eye on all public and private variables during runtime, making sure that no variable is assigned an unexpected value. To activate the Debug mode:
- Click on the menu icon in the top-right corner of the Inspector.
- From the context menu that appears, select the Debug option:

Figure 2.35 – Activating Debug mode from the object Inspector
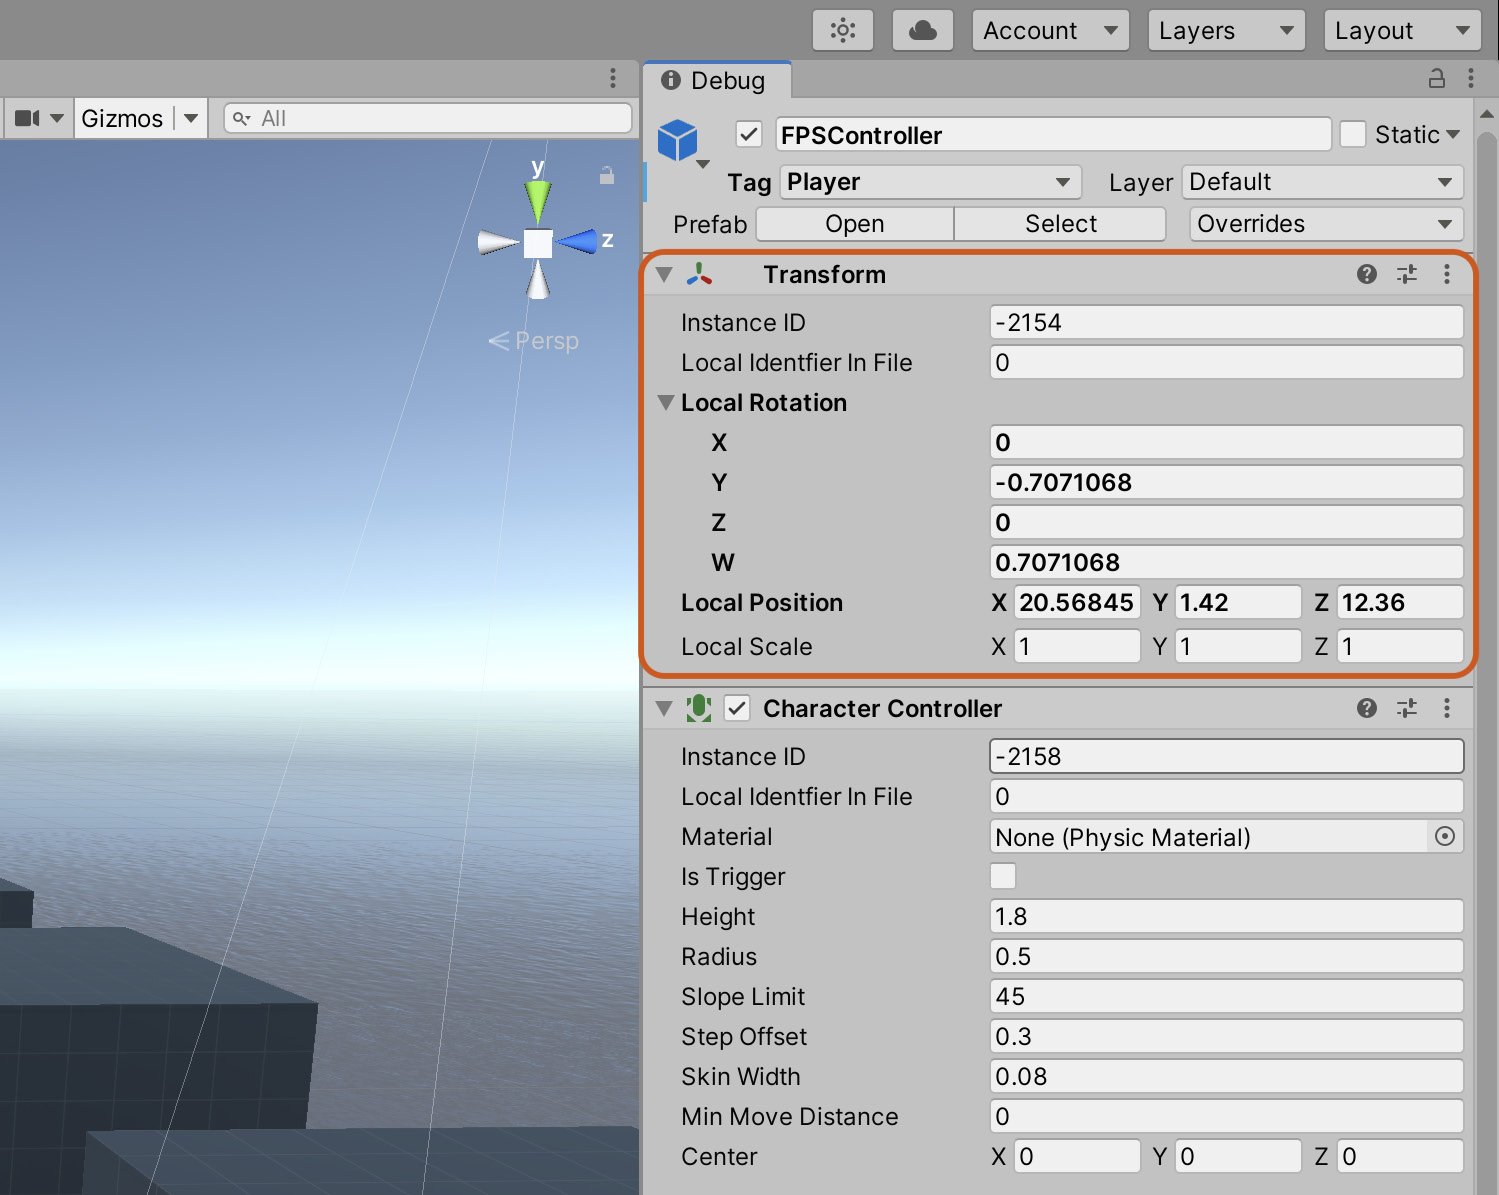
After activating the Debug mode, the appearance of some variables and components in the Inspector may change. Typically, you'll get a more detailed and accurate view of your variables, and you'll also be able to see most private variables. See Figure 2.36 for the Transform component in Debug mode:

Figure 2.36 – Viewing the Transform component in Debug mode
Debugging individual components can be very useful when you are having problems with specific areas of your game; for example, when your player isn't moving as intended, you can see the private variables of your Character Controller script. However, to gain a broader understanding of how your game is performing, you will want to use the Stats panel.
Monitoring game stats
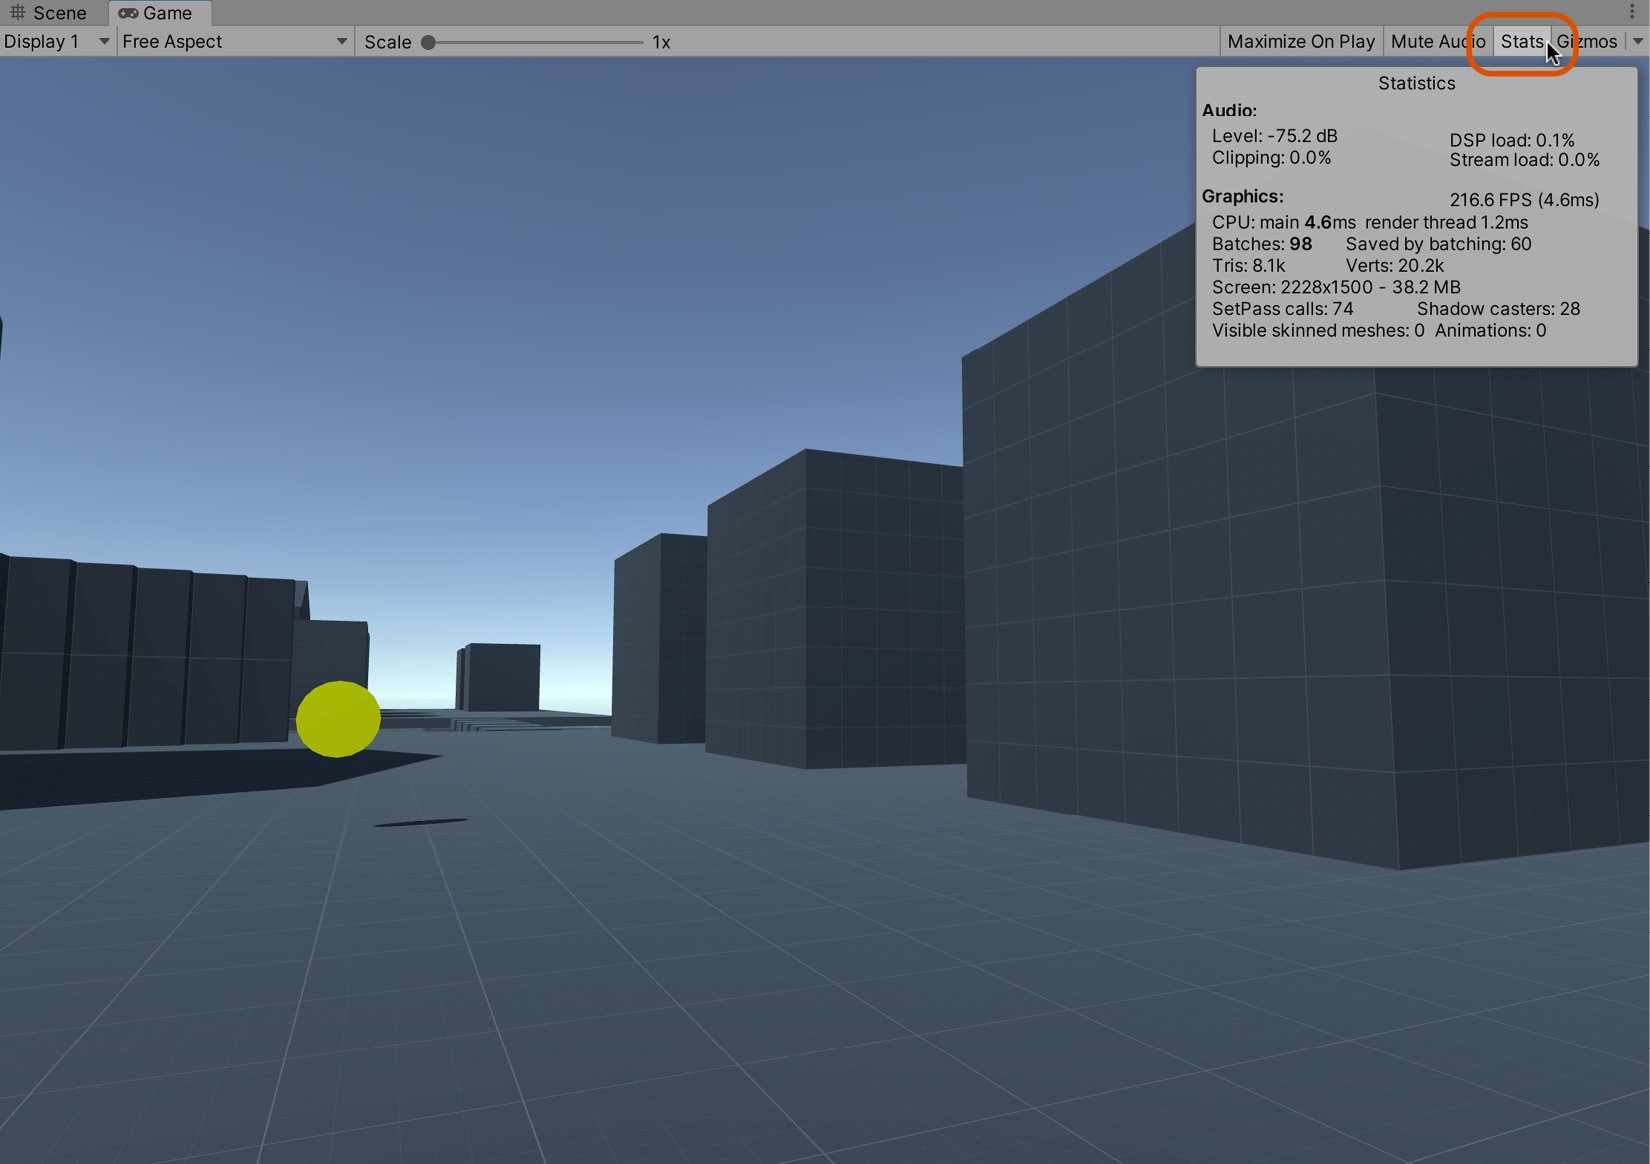
Another useful debugging tool at runtime is the Stats panel. This can be accessed from the Game tab by clicking on the Stats button on the toolbar, as shown in Figure 2.37:

Figure 2.37 – Accessing the Stats panel from the Game tab
The Stats panel is only useful during the Play mode. In this mode, it details critical performance statistics for your game, such as Frame Rate per Second (FPS) and memory usage. With these stats, you can diagnose or determine whether any problems may be affecting your game. The FPS represents the total number of frames (ticks or cycles) per second that your game can sustain on average. There is no right, wrong, or magical FPS, but higher values are better than lower ones. Higher values represent better performance because it means that your game can sustain more cycles in 1 second. If your FPS falls below 20 or 15, your game will likely appear choppy or laggy. Many variables can affect FPS, some internal, and some external to your game. Internal factors include the following:
- The number of lights in a scene
- The vertex density of meshes
- The number of instructions, and the complexity of the code
Some external factors include the following:
- The quality of your computer's hardware
- The number of other applications and processes running at the same time
- The amount of hard drive space
In short, if your FPS is low, then it indicates a problem that needs attention. The solution to that problem varies depending on the context, and you'll need to use judgment; for example, are your meshes too complex? Do they have too many vertices? Are your textures too large? Are there too many sounds playing?
Important note
The completed game source code can be found in the book companion files in the Chapter02/End folder.
Once you're happy with how your game is performing, it's time to build the game so it can be run without Unity.


